"When misguided public opinion honors what is despicable and despises what is honorable, punishes virtue and rewards vice, encourages what is harmful and discourages what is useful, applauds falsehood and smothers truth under indifference or insult, a nation turns its back on progress and can be restored only by the terrible lessons of catastrophe." … Frederic Bastiat
Evil talks about tolerance only when it’s weak. When it gains the upper hand, its vanity always requires the destruction of the good and the innocent, because the example of good and innocent lives is an ongoing witness against it. So it always has been. So it always will be. And America has no special immunity to becoming an enemy of its own founding beliefs about human freedom, human dignity, the limited power of the state, and the sovereignty of God. – Archbishop Chaput
Trader Dan's Work is NOW AVAILABLE AT WWW.TRADERDAN.NET
Take a look at the chart and you will see what I meant in choosing the title for this post.
In the last two months alone, the NET LONG position of the hedge fund community has been cut in half. That has come about by a combination of both long liquidation and the addition of new short positions. Currently it is at 71,376.
What is rather disturbing is that the number of outright long positions ( both futures and options combined ) of 129,921, remains rather large compared to the last time gold was trading near these levels in the first week of June of this year.
Back then, hedge funds were holding 121,428 outright long positions when gold was at the $1244 level. Their short holdings were at 70,364 compared to this week's 58,545. That put them at a NET LONG position of 51,064 compared to this week's 71,376. That is a net contract difference of over 20,000 contracts!
That is why it is important that $1240-$1235 did not hold. The potential for additional long side liquidation PLUS net shorting from these technically oriented hedge funds, opens additional downside probabilities. If the funds begin to wash out and also move more towards the short side, the selling pressure would intensify. It would be enough to set up a test of $1200 without some sort of upside catalyst occurring very, very soon.
For those interested in looking at the mining shares ( frankly there are a lot more interesting charts than gold miners to look at right now) here is the weekly chart of the HUI.
Here is a quick overview....
The index has managed to avoid breaking down below the key 200 level; however, upside progress has been minimal. Note the series of lower highs indicative of general weakness in the sector.
This week's close pushes it back below the major moving averages that I track with it looking like a new downside push back towards 200 is possible once again. Much will depend on how the Dollar functions next week and what we get coming out of the Fed.
This index has been limping along in a lower grinding pattern for the last 21 months after suffering a devastating collapse two years ago when it failed to clear 525.
For now, the most likely pattern is more of the same grinding sort of trade. Value based buyers are bottom fishing in the sector on ideas that the stocks have been beaten up so severely that they have pretty much factored in the worst. The problem for these shares is that IF GOLD WERE TO LOSE $1200, and not be able to recapture it, many who bought the shares will throw them out fearing another fresh leg lower in the precious metal.
Either this index needs to get above 280 for starters, and preferably close the gap at 300, to turn sentiment or the gold price will have to jump sharply higher from current levels.
By the way, here is a current chart showing the HUI compared to the price of gold in a ratio. For the shares to lead the metal higher, this ratio would need to take out .200 for starters....
Here is a look at the current ( as of this Friday ) positioning of the players in the copper market. As the regular reader will already know, I pay very close attention to two key markets - Copper and Crude Oil, when trying to ascertain what the sentiment is of investors/traders towards overall economic growth.
I recently posted a chart detailing the performance of the S&P 500 versus the Goldman Sachs Commodity Index showing the vast underperformance of the commodity sector against equities in general. My conclusion, based on that chart, was that global growth was mediocre at best and that stock market strength is more a function of Yield Chasing by speculative forces in a near Zero interest rate environment rather than evidence of a robust growing economy.
The shift in speculators, especially the large hedge funds, into playing copper from the short side, confirms that view in my own mind.
Notice earlier this year how upbeat the hedge funds were on the future prospects of copper. July of this year saw them very optimistic. Here we are a mere two months later and they have completely reversed sides and have moved to a net bearish position. That dichotomy between the "other large reportables" category and themselves has evaporated ( although the former category is in the process of covering existing short positions ).
What to make of this?
Take a look at the copper chart and tell me what you see here.
Does this chart even remotely resemble one that is the least bit bullish? Of course it does not. Copper is continuing in its now 3 1/2 year old bear market.
Highs are progressively lower and lows are getting lower. What this tells us is that global demand for copper is not keeping pace with the increases in supply. Another way of saying that, is global growth is not strong enough to generate sufficient demand for the red metal that will allow it to eat through the available supply.
That is hardly the thing out of which strong, runaway inflation pressures are born.
By the way, here is an updated chart of the overall commodity sector as of the close of trading this week. Again, I am using the Goldman Sachs Commodity Index or GSCI.
The sector notched a 27 month low this week.
I have commented in the past that silver and copper tend to move in rather close sync.
Here is a chart of silver.
As you can see, the chart pattern is very similar to both the copper chart and the overall commodity sector, although silver has been bouncing around going nowhere for the last year.
What explains this lack of performance to the upside? Answer ' "Price manipulation" will scream the usual culprits. "The powers that be are actively working to manipulate the silver price lower!", they will breathlessly assert.
That is not the case however. Look at what the hedge funds are doing in there. They are abandoning the long side and beginning to move more towards the short side of this market as well, just like they have done with copper., and I might also add, a host of other individual commodity futures markets. I would guess, because this COT data only covers through Tuesday of this week and did not catch the fall through support near $18.60, that the hedge funds may now, as of this Friday, be net short in the market.
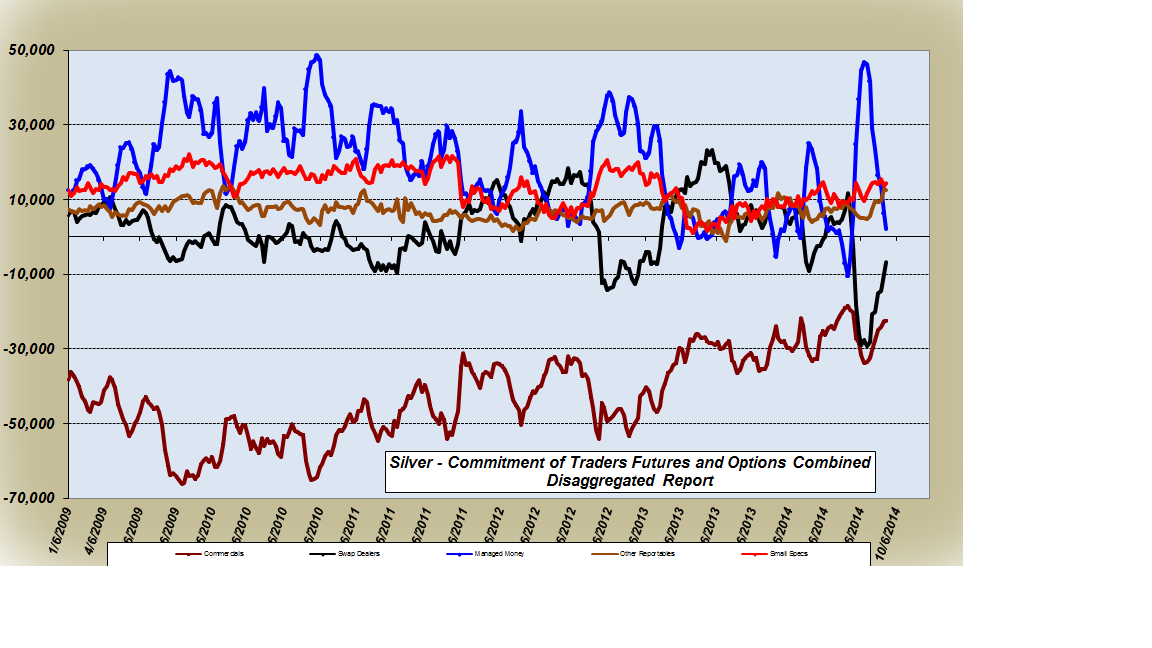
Keep these things in mind when you read outlandish predictions of roaring silver prices "any day now". Such claims are laughable at face value because they are based on NOTHING but someone's fevered imagination. Those who make such rash claims are exhibiting in full public, their apparent need for some sort of self-aggrandizement to make them stand out from the crowd. Serious traders will ignore such shills. Professionals DO NOT MAKE PREDICTIONS; they read the market and attempt to discern what it is saying.
For silver to turn around sharply, there will need to be some sort of catalyst in the form of a shift towards strong global growth, strong enough to generate inflation concerns and cause an inrush of money flows into the broader commodity sector. For the time being, that does not look to be on the radar screen.
How it handles this level near $18.60 will be critical. If it can hold near here, it will have a chance to reverse course and move back to try for a test of $20. Above that $21.50 stands as a huge hurdle to any further upside progress. At this point, the trend in silver is sideways to lower and unless we see something change on this chart, that is the way it looks as if it will continue.
I have posted this chart fairly regularly now for some time to give a more intermediate term look at the gold market for those who are interested.
Not a single thing has changed for gold in over a year now. The metal is still trapped within a broad range defined on the chart. It is now working its way down toward the bottom of the range having failed to make any new weekly high. As a matter of fact, the pattern for gold has been one of LOWER HIGHS for over a year now within that range. That is suggestive of weakness.
This week the HIGHER LOW was broken and while it is still not the end of the trading session for Friday, the metal is threatening to put in a LOWER LOW within the range compared to the May close. That is a sign that the odds favor a move down towards $1200 unless it swiftly reverses and regains the $1240 level in a convincing fashion.
As said many times here to the point of taxing the reader's patience - it is no where written that a market must either be trending lower or if not, then trending higher. Markets can often move within broad, well-defined ranges for a long period of time; essentially they go nowhere. What that suggests is that supply/demand are essentially in balance within that range of prices. Unless an external development occurs which CHANGES the balance between the forces of demand and the forces of supply, the most likely outcome is a furtherance of the range trade.
I find it therefore rather disconcerting that so many of the gold-perma bulls continue their mantra of "Keep Stacking". For those who want to acquire some physical metal for insurance purposes, buying gold near the bottom of a well defined trading range makes sense. However, for those who "keep stacking" while they wait for the "any day now moon launch", theirs is a 'strategy' that has more odds of leaving them disappointed rather than obscenely rich as they dream. As mentioned above, range trades for markets are more the norm than solid, trending moves. The trending moves occur because something happens which triggers a new valuation of the underlying market whether that be an increase in the demand side of the ledger or in the supply side of the ledger.
Take for example the recent rallies in the cattle market, especially feeder cattle, and the recent sharp downdraft in the corn and bean markets. In the case of the bull market in cattle, the supply side has been constrained as ranchers and producers seek to rebuild herds devastated by back to back drought years in 2011 and 2012. The result has been increased demand with sellers of the animals in control as they have the luxury of sitting back and waiting for buyers to pay up and chase prices higher.
In the case of the bear market in the grains, the supply side of the equation continues to increase as the size of the expected harvest increases with each new USDA monthly report. That gives buyers the advantage because they have the luxury of sitting on their heels and waiting for even lower prices before committing in size.
In other words, both markets are imbalanced at the moment and seeking to find a price level or a range which satisfies both sellers and buyers that prices have reached a fair value level.
For gold to therefore move out of its range, a trigger will need to occur. Without that, gold bulls will be disappointed that the metal cannot escape from the upper boundaries of its 14 month long range. Gold bears also have not yet been able to crack prices below the bottom of the range starting near $1200 and extending down to $1180. Within this very broad range, a truce exists between both buyers and sellers. Shorter term within the range; however, there are signs that the buyers are regaining an advantage as demand is falling for available supply meaning sellers are willing to take less for their gold. As long as that is the case, the price will move lower. It will not be until they are more buyers at a lower price than there are willing sellers that the price will bottom. Trying to ascertain at what level that might occur is the business of traders.
If there is a change in either supply or demand, the market will reflect that as the price chart will change accordingly. Until then, prognostications, predictions, rash claims, etc, about surging gold prices are just that, rash claims founded on nothing but air with no basis in the price chart or in the technical patterns. Objective viewers and students of the markets learn to dismiss all such voices and listen to the only voice that matters - that of the market itself. It and only it knows when demand and supply have come into balance.
I find it rather fascinating to see the depths of denial that some will sink to when it comes to taking the Federal Reserve's clearly announced intentions to wind down its final Quantitative Easing program. You might recall that this last of their QE's was originally in the amount of purchases of both Treasuries and MBS (Mortgage Backed Securities) debt to the tune of $85 billion/month.
The chart I put together should hopefully dispel the rather foolish talk from some as referenced above and help objective and open-minded observers understand where the Fed is in its intent to bring this program to an end.
The chart details the Rate of Growth/Decline in the "Securities Held Outright" portion of the Federal Reserve Balance Sheet. For all practical purposes, this might as well be considered the total Balance Sheet ( the other items that are involved are dwarfed by comparison ) but that is another matter. Suffice it to say, one can easily tell the start up and the decline or winding down of the various QE episodes that have been in place since the Credit Crisis of 2008 and the Fed's response to that.
The data is constructed by creating a look-back period of 52 weeks and noting the percent change of the current week to the same exact week exactly one year previous. By looking at the data in this manner, we can get a very good view of how the Fed was responding to the lock up of the Credit markets and its determination to be a buyer of last resort of both MBS's ( mortgage backed securities) and Treasuries.
One can see the amazing surge in the 2009 as QEI was undertaken. Then we would see the end of a QE program, and the implementation of the next. The RATE OF INCREASE in the Fed's Balance sheet can easily be noted.
Fast forward to the beginning of this year and the Fed's announced intentions of a "TAPERING" of its final bond buying program with the intent to end it sometime this year.
Note well that the Fed did not say it was going to stop buying both Treasuries and MBS debt when it first began making the markets aware of its timetable to end QE4. It announced that, depending on the economic data, it would begin to scale back those purchases ( roughly $10 billion each month) until it ended them altogether.
Thus while its balance sheet continues to grow, the RATE OF GROWTH, year over year, is definitely declining. Indeed the Fed is tapering just as it said it would.
Just for comparison sake, here is a chart of the overall Fed Balance Sheet ( Securities ) so that the reader can see the growth. It is rather remarkable is it not? Even in this view, one can see the leveling off of the line over at the far right hand side. Their purchases are slowing down.
The reason for this short set of comments and charts is simple - there are those in the gold permabull camp who continue to deny that the Federal Reserve is tapering and preparing to end its QE programs. We will let the reader decide from the data whether their claim has any merit. I for one reject their specious assertions.
Now, it is going to be an entirely different matter if the Fed chooses to actually REDUCE the size of their balance sheet. That is going to be an interesting education we will all receive when once that happens, if at all. For all that one knows, they could simply choose to hold the securities (Treasuries and MBS debt) until they mature and return any interest earned to the Treasury.
Talk about a bearish set of reports! Most everyone was expecting the numbers to be on the bearish side as reports from private firms have been indicating crops in incredible shape with the potential for strong yields picking up with the passing of each month. USDA tends to be a bit conservative however and that had most in the trade expecting them to confirm higher yields but to wait for their October report before getting too optimistic.
Boy howdy was that NOT the case!
In the case of soybeans, USDA left both planted and harvested acreage unchanged from their August report (84.8 million and 84.1 million respectively) but it was the big jump in yields that caught many off guard. They found another 1.2 bushels per acre of yield from the August number of 45.4 to an astounding 46.6!
The result - a massive crop of 3.913 billion bushels, well up from last months 3.816 billion. Combine that with imports of 15 million bushels and the total supply jumped to 4.058 billion bushels of beans. I am still reeling when looking at that number!
USDA increased both crushings and exports from August bringing total usage to 3.583 billion bushels. That leaves a carryover of 475 million bushels, more than THREE TIMES Larger than the past marketing year number of 130 million.
Beans wasted no time in adjusting to the new numbers and are sharply lower as I type these comments.
When it comes to corn, they did the same thing as they did with beans on the planted and harvested acreage -= they left them unchanged at 91.6 million and 83.8 million respectively.
The kicker was a huge leap in yield coming in way above what most in the trade were expecting at this stage of USDA reporting. Last month's yield estimate was 167.4 bushels per acre. That in itself is phenomenal. This month, they moved that number up to an eye-popping 171.7 bushels per acre! WOW!
the result is a total production number of 14.395 billion bushels, well up from last month's already incredible number of 14.032 billion.
USDA increased feed usage slightly ( I am not quite sure why they are doing that unless it is coming from ideas of increased poultry and hog production). Exports were increased by only 25 million bushels. Ethanol production will consume an additional 50 million bushels compared to last month's estimate.
Even with the increase in usage, carryover will end up at over 2 billion bushels of corn, not quite more than double that of last year's crop.
What is even more astonishing to me as a trader is the fact that this is occurring against a backdrop in which the hedge fund community and the large reportables are overwhelming on the NET LONG side of this market. Talk about a recipe for a trading disaster! Rarely have I seen this group get a market so wrong! My concern is that their compounding and significant losses on their positions are going to engender even more selling in the corn market!
One thing I can definitely say - if this crop manages to get to harvest without any serious frost issues ( and it is running a bit behind normal maturity), hog, cattle and chicken producers are going to be in "hog heaven".
It is about time for those guys to get a break and this is a big one. They deserve some much needed profitability, especially in the hog industry where PED virus has negatively impacted so many.
By the way, as an important corollary connected to my post last evening comparing the S&P 500 to the overall commodity sector. The GSCI did another swan dive today with these sharply lower grain prices adding more to the bearish environment for commodities in general.
Silver is looking like it is going to crack major support near $18.60 especially with soybeans swooning like they are.
Gold has lost critical support at $1240 as I hurriedly try to type these comments. It is hovering just above the bottom of a band of support extending from $1240-$1235. If it loses that, $1200 looks like it is coming.
Ever since the Fed embarked on its journey with Quantitative Easing, we have all been getting an education in how the markets are responding to this grand experiment. Now that they are scaling back their bond buying program, we are also getting an education in how the markets are responding to that as well.
Most of the longer term readers here at the site will know that during the initial years of QE, nearly every asset class began moving higher. Some moved in response to ideas of liquidity injections while others moved higher in response to anticipated currency weakness.
This rising tide continued in near perfect sync until sometime in early 2012. That is when the commodity sector in general divorced itself from the rising equity markets.
As you can see from the chart that follows, stocks have moved relentlessly higher while the overall commodity sector has continued to sink. Just today it notched a 27 month low.
Yet in spite of this, we still have some telling us to prepare for runaway inflation any day now and of course with that, soaring precious metals prices.
The question one should pose is "WHY?". What evidence is there to suggest that a soaring move higher is just around the corner in precious metals?
Let's consider what this comparison chart is telling us. It is my contention that the reasons equities continue to rise is because they have become the only game in town when it comes to large speculators obtaining yield in a near zero interest rate environment. Also, something to consider is that US Dollar strength is attractive to foreign investors looking not only to obtain yield but also to capitalize on currency gains. In an environment in which the Dollar is generally strengthening against the majors, a foreign investor can move money into the US markets, not only obtaining a capital gains but also getting more "bang for their buck" when they finally cash out and make the currency exchange.
So not only do we have domestic-based firms and funds buying equities, we have strong inflows of foreign capital also feeding the equity bull.
That being said, a rising stock market does not necessarily equate to a strong and healthy overall economy. We have come to see this over the many years that this experiment in QE has been ongoing. When investors are looking for yield, they go where the bulk of the action is and that has been equities. Ask any competent money manager and they will tell you that they will not long be in the business if they are not producing solid gains for their clients. In a sense, they have no choice but to buy equities. I might add that I believe this is precisely what the Fed intended by driving interest rates to extremely low levels and providing so much liquidity. That money had to go somewhere and into stocks it has gone.
Central Banks want rising equity prices to feed consumer and business sentiment and they got just that!
The shortcoming of this experiment has been growth, while it has leveled off here in the US is not strong. As a matter of fact, one can see that whether through falling demand or rising supply or a combination of both, hard asset prices, aka, commodities, are falling in price.
I have long maintained and continue to maintain that this is evidence of a deflationary wave that Central Banks have not been able to reverse. They have succeeded somewhat in blunting its worst effects but reverse it they have not. Consider the fact that the ECB might yet be forced to effectively go the way of both the Bank of Japan and the Fed and implement its own version of QE if their recent measures fail to generate any strong growth in the Eurozone.
I have said all the above to come to this point - I will not argue whether stocks are overpriced or not. Frankly I do not care nor does the market at this point. Stocks are where the gains and have for the last few years, especially compared to commodities in general since 2012. Once that is understood, whether or not one likes it or approves of it is immaterial, one is on their way to understanding something about the nature of our modern markets. Money flows to where it can obtain a yield. It is that simple.
However, and this I believe is most important, if the economy was actually growing as robustly as the soaring equity markets would seem to indicate, commodity prices would NOT BE FALLING. I think that is axiomatic and needs no further explanation. Look at the comparison chart and tell me that they are not going one way while equities are going the other. What this does tell is however is that current levels of demand are not strong enough to absorb the current supply.
Along that line, I have maintained also that inflationary pressures cannot break out here in the US, or elsewhere for that matter, unless and until WAGES MOVE HIGHER. They remain stagnant however.
Many of those who oppose my current outlook on gold will bring up the fact that the cost of many basic items seem to be going up and that this is evidence that inflation is present. They also maintain that the rise in prices is threatening the middle class and its way of life. They cite that as a reason to buy gold - to protect their purchasing power. I will only comment on this insofar as to say, that for the last few years, gold has been a pathetic investment to "protect one's purchasing power". The metal has collapsed in price from $1900 all the way to its current price of $1250, much like the vast majority of individual commodity prices have collapsed lower. What is so sad is that many of those advocating such things are generally much more in tune with what is happening in the broader global and national economy that the average Joe and Jill, who stuck with stocks and did nothing. The latter looks like investing geniuses while the former look like dolts. It is said that "Ignorance is Bliss" ( a saying that I personally do not ascribe to ) yet in their case, it sure seems like that is the truth!
I sincerely believe that is not the point, at least as far as investing or trading goes. What is the point, and this is assuming that their claim is true, is that wages are failing to keep up with the rise in services or goods and thus that is crimping peoples' disposable income.
After all, one has only so much money to spend, based on their take home pay, which has been relatively stagnant for many years now. If a larger share is given to buying "essentials", it is mathematically simple to understand that leaves less money available to spend on "wants". My question is, in such an environment, in which wages are flat, and growth is slow, and disposable income is tied up in essentials, where are the pressures going to come from to launch this long-heralded wave of inflation that will drive gold and silver prices inexorably higher? I maintain that the ingredients are therefore missing.
To me it goes back to Wages and thus back to the Velocity of Money. Until wages move higher it is my contention that inflation of the scope great enough to attract the attention of market participants of size will not occur. Currently the TIPS Spread is falling, not rising. That is the best source to measure the sentiment of those who watch this sort of thing most closely. Any open-minded, objective survey of the chart will show FALLING INFLATION EXPECTATIONS are currently in ascendency.
I have said it before and will so say again - falling commodity prices are not conducive to bull markets in gold and silver. It will take a geopolitical occurrence at this point to change the bearish sentiment that is currently dominant in both markets.
The chart says it all - it is wonderful seeing some further relief at the gasoline pump!
Meanwhile, the general weakness in the overall commodity index continues with the Goldman Sachs Commodity Index registering a fresh 27 month low in today's session.
Has the blow off run in feeders finally come to an end? It is a bit premature to say but this particular market has seen what can only be properly described as a buying frenzy. Those looking to secure replacement animals have been pushing the panic button due to the shortage in supply but at these levels, and based on what the board is giving for next year's cattle prices, they are locking in large losses by paying these kinds of prices. That has not seemed to matter however. Maybe it now will. We'll see.

Looking at the chart of the commodity sector in general, and the chart of the strong Dollar, it strikes me as odd, and that is putting it mildly, to see these continued calls for a surge in the gold price from the usual gold perma bulls. Upon what basis do they make such a claim? With the yield on the Ten Year above the 2.5% level, with market participants talking more and more Fed rate hikes by the middle of next year, with sinking inflation expectations as determined by the TIPS spread, such calls for sharply higher gold seem to smell more of desperation than anything grounded in objective analysis.
The only thing currently supporting gold has been geopolitical concerns. Whether that be Ukraine, ISIS, Gaza and now, the upcoming Scottish independence referendum, which has some spooked because of the shift in the polls in favor of the move as the date draws near, such things have helped to prevent what I believe would otherwise have been a sharper drop in the price of the metal.
Also helping the metal somewhat has been general skittishness in the global equity markets over that self-same Scottish vote.
In spite of such things, gold has managed to drop through one support level after another on the price chart. It lost psychological support at the $1300 level last month, fell to $1280 from where it bounced but then promptly collapsed through $1280 in grand style. It then hovered around $1260 before losing that as well. Now it is having trouble at psychological support near $1250. If it fails here, it is set up for a test of major support near and just below the $1240 level. Failure there and I suspect we will see a test of the $1200 level. Remember, based on our relatively recent analysis of the COT Reports, a lot of hedge fund, old and now stale, long positions go underwater below $1240.
For bulls to have any hopes of mounting the "Gold will trade north of $2000 this year" - You know, another seemingly failed prediction by one of the self-proclaimed 'experts" - it will first have to regain the $1300 level with some gusto but more importantly, the $1320 level. Could it do that? Sure it could as anything is possible in these markets but for now the trend is lower and the bears are in charge.
Lastly, the grain markets are continuing to monitor the weather forecasts to ascertain whether or not it is going to be cold enough, for long enough, to do much damage to crops across the northern tier of the US growing regions. For now, it does not appear that any frost event will do that much damage but traders are staying alert for any sign that models could turn a bit colder. After this episode of cold for the next couple of days, it looks as if we are going to get a warm up and a return to more seasonal temperatures.
Also on the plate is an upcoming USDA report where we will get a look at what the agency is giving for yield and production numbers. A lot of private firms have already weighed in with their numbers but USDA is still the accepted authority.


