"When misguided public opinion honors what is despicable and despises what is honorable, punishes virtue and rewards vice, encourages what is harmful and discourages what is useful, applauds falsehood and smothers truth under indifference or insult, a nation turns its back on progress and can be restored only by the terrible lessons of catastrophe." … Frederic Bastiat


Evil talks about tolerance only when it’s weak. When it gains the upper hand, its vanity always requires the destruction of the good and the innocent, because the example of good and innocent lives is an ongoing witness against it. So it always has been. So it always will be. And America has no special immunity to becoming an enemy of its own founding beliefs about human freedom, human dignity, the limited power of the state, and the sovereignty of God. – Archbishop Chaput

Trader Dan's Work is NOW AVAILABLE AT WWW.TRADERDAN.NET


Saturday, April 27, 2013

Gold Commitments of Traders Report - Update I

Yesterday (Friday) I posted some comments doing a bit of analysis on the Commitment of Traders report for Gold. In those comments I noted that it looked to me as if the General Public, the smaller speculator, usually underfunded and not well capitalized, was holding their smallest net long position going back over a decade.

I have managed to finally find a bit of time to confirm that.

Here is the data in chart format. Note, the general public is the LEAST BULLISH ON GOLD since the very beginning of the decade+ long bull move way back in 2001. You will recall that gold was coming off a twenty year bear market back then.


Even during the depths of the credit crisis in the latter part of 2008, the general public, in spite of a sharp crash in the price of  gold, still remained biased towards the bullish side, even though that sentiment took quite a hit during that downdraft.

Fast forward to this past week and you can see how rapidly sentiment towards gold, on the part of the small speculator, has been damaged. All I can say about this is if the Central Planners wanted to discredit gold as an alternative currency to the Dollar, they have certainly managed to do just that. They have gotten the entire speculative camp, hedge funds, other large reportables and the small speculators selling gold while the bullion banks and swap dealers are in the process of buying it.

Keep in mind that this is using the paper Comex markets as the benchmark against which most of the investment world leans when it wants to know what the price of gold is doing. Most people outside of the gold community do not even know what a gold coin dealer shop looks like or where even to find one. Mention the words, "spot price of gold" and you are liable to get someone asking why the metal is spotted.

Let's keep a close eye on this to see if we can spot any shift in sentiment. Markets that have suffered such brutal maulings need some time to repair the psyche of those who have been on the wrong side of a move of that nature and been devastated as a result.

This is the reason that I am not in the camp with those who believe that we are now going to see an immediate rocket shot higher in gold. I can assure you as a trader that once you are on the wrong side of a trade of this nature, and watched your trading account or investment capital been blasted into the nether regions, you are in no special hurry to plunge right back into that market. You need time to lick your wounds. There are probably people out there who are swearing out loud right now that they will never even look at another ounce of gold, much less plop down money on a gold investment, especially a mining share!

This market will thus need some sort of healing process in my view to convince the skeptics that it is for real.

Those of us who believe in honest money, need to understand that the majority do not look at these things in the same manner in which we do. Thus, the mass exodus out of the Comex gold markets and the gold ETF. If gold can continue to stabilize here and avoid any further sharp downside plunges, that will go a long way to convincing some of the new skeptics that the worst is over and give some the confidence to wade back into the water.

Traders and other investment types will be looking for another retracement lower in price to see where the support emerges. They will be especially interested in seeing where the strong physical offtake begins to fade at these higher price levels.


Trader Dan Interviewed at King World News Metals Wrap

Please click on the following link to listen in to my regular weekly radio interview with Eric King over at the KWN Markets and Metals Wrap.

http://www.kingworldnews.com/kingworldnews/Broadcast/Entries/2013/4/27_KWN_Weekly_Metals_Wrap.html

Friday, April 26, 2013

Notes on Gold's Commitment of Traders Report

A brief summary - All classes of speculators, hedge funds, other large reportables, and the general public, were net sellers of gold this past reporting period.

The other side of the equation, the buying, was done by the commercial category (bullion banks, etc,) and the swap dealers. The swap dealers, in particular, are a very good group of traders since they trade not only for clients and for the purpose of hedging, but can also speculate for their own interests.

I should note here that both of the latter categories, remain net short overall but continue to consistently reduce that position as they cover existing shorts and institute fresh long positions.

The small specs, the general public, are now showing the smallest net long position on record from this report which dates back to the beginning of 2006. In going back even further to 1999, they still have the smallest net long position that they have held in over a decade. That is quite remarkable!

The general public is usually a very good contrarian indicator as they are notorious for being on the wrong side of a trade at critical turning points. However, that does not mean that they are always wrong. You must admit, the small specs who have been playing gold from the short side have done pretty doggone well this year while hedge funds have not! Recent action however has not been kind to many of them since a great deal of them have sold short beneath $1400 are those positions are probably blown out of the water by now. Many of them were casualties of this week's rebound in price.


The hedge funds, while remaining net long, continue to rapidly draw down that net long position. As I suggested last week and it seems to have been confirmed this week, hedge funds covered some shorts LAST WEEK on the second attempt down towards $1330 that held. Then they waited for prices to rally towards $1400 whereupon they began to sell anew. It is this group which is selling rallies in gold and will do so until the technical posture of this market shifts from one being bearish to one being bullish. For that to occur, gold must recapture a "15 handle and KEEP IT!.

One thing we have yet to see is the hedge funds moving to an outright short position in gold as they have done in copper and may perhaps be threatening to do so in silver (its fortunes are tied to copper for the time being). This implies that should they actually begin as a whole to approach gold from the short side, the potential remains for their firepower to take price lower towards that support zone that has now been established between $1330 - $1325. That would indeed set up a battle between the physical market buyers of the metal and the paper sellers!

I covered this in this week's KWN Metals Wrap with Eric King over at King World News so be sure to tune in to that on Saturday when it is posted to here this in more detail.

Copper Bounces but will it Hold?

We have been students of Dr. Copper for a long time over here since it has a track record par excellence. This week the red metal experienced a bout of short covering from speculators who have been steadily pushing it lower for the better part of this year.

Again, at the risk of beating a dead horse here for the umpteenth time, I am on record here as stating the current rally in equities is nothing but a massive Central Bank liquidity induced bubble without the least bit of fundamental underpinning. My reason for this view - Dr. Copper, whom I trust far more than lemming like equity buyers, says "No Deal".

In spite of trillions of dollars in Quantitative Easing (the balance sheet of the Fed is now over $3 TRILLION and rising) the best the Central planners have been able to do is to generate economic "growth" a trifling bit north of 2%! That is astonishing.

Economies globally continue to either experience a slowing in the rate of growth or are barely limping along. The result has been rather lackluster demand for a metal which typically rises in price during periods in which growth is robust.


From a technical standpoint, copper hit a region (noted on the chart) in which it previously experienced a good deal of buying back during the summer of last year. That level extends from $3.10 - $3.00. When prices came into this zone last week buyers surfaced. They did again on a second test of that level this week. So far then support is holding and the market is stabilizing.

Incidentally, the Commitment of Traders report reveals some decent short covering on the part of the hedge funds as price held this zone. Now that we have seen price move higher, the question is whether or not they are going to re-enter this market on the short side and sell it down from this higher level.

Here is what I would watch more than anything else - be that talking heads on the various financial news channels, newsletter writers, etc. - the SUPPORT ZONE in this metal.

If it fails to hold price and copper begins a fresh leg lower, watch out. It will indicate that Central Bank reflationary policies are failing. Now the fools who keep chasing stocks higher and higher will probably care less but more savvy investors will take note of this barometer.

Quite frankly, I would not know what to expect from the Central Banks were this level to give way. Would they be forced to actually increase the level of bond buying? I am not sure. It all depends on whether or not the rest of the commodity world would follow copper lower. Either way, it would signal that deflationary pressures are overcoming Central Bank inflationary efforts.

If it holds, then the odds favor more of a range bound type of trade with prices moving back up some as traders/investors would see economic growth just strong enough to prevent prices from falling any lower but not quite good enough to see this market rocket up. In other words, a sort of uneasy truce between bulls and bears with bears banking on deflationary pressures to prevent sharp rises in price and bulls banking on lots of funny money to grease the tracks of the global economy to prevent any drastic decline in price.

The key point that I take away from all this - Central Banks are playing with fire by their continuing interference into the markets. Adam Smith must be rolling over in his grave somewhere.

Gold Bounce coming to an End

Time constraints have prevented me from writing as much as I would have preferred to this week but I want to refer back to my last comments from Wednesday this week when I posted a 2 hour gold chart.

My argument back then was and still remains the same today - there is no enthusiasm to chase prices higher at the Comex gold market. That is indicated by the falloff in volume as price has moved higher. See the chart below....

In other words, this is more of a case of traders covering short positions out of fears popping up over bona fide reports of incredibly strong buying of physical gold than it is over a new found bullish enthusiasm on the part of the hedge fund/investment community.

Yesterday, the return of RISK ON trades came on the heels of the rotten economic data out of the Euro Zone. Once again we are in a situation where for the equity perma bulls, it is "Head's, I win; Tail's, you lose". The news was so bad that traders just knew it in their bones that ECB President Draghi is going to announce an interest rate cut next week. That of course is just what the equity bulls ordered.

Today however was a different case with the moribund GDP reading here in the US serving to remind us all that in spite of all of this reckless Central Bank liquidity creation, we are barely managing to limp along at the bottom when it comes to economic growth. Copper obviously wanted no part of this news today as it appears the short covering rally in that base metal might have come to an end also.

With the yield on the Ten Year Treasury note dipping back to 1.66% and with the 30 Treasury bond futures up nearly a full point today (not to mention the regularly recurring stupidity trade of buying the Yen as a safe haven), it is evident that whatever risk traders were willing to put on yesterday, they are taking it off today.

When it comes to gold here is the situation as I see it (nothing has changed in this regards but I want to restate it again) - Physical demand for gold is very, very strong; however, it is very, very strong at REDUCED PRICE LEVELS. Gold went on a fire sale last week and buyers jumped all over it. After all, a $200 drop in the matter of a couple of days is enough to get the attention of anyone wishing to acquire a metal that had a handle of "15" in front of it and then suddenly had one of "13". This has served to put a solid floor of support beneath the market and I believe a bottom that should hold if prices were to move back down towards that level in the near future for any reason.

The problem that I see is the same; while this sort of demand can bottom a market it CANNOT TAKE IT SHARPLY HIGHER without INVESTOR DEMAND from the hedge funds. Why? Because buying of physical is price conscious. People buy the stuff because it is so cheap. When it jumps back up too sharply, that kind of buying dissipates. What is then needed to take the price higher is the kind of mindless buying by hedge fund algorithms which have no conception of value whatsoever but are programmed to only chase motion.

Value based buyers acquire the metal when they perceive it to be cheap or underpriced. Hedge funds buy the metal when it keeps getting more and more expensive. Their buying kicks in when the value based buying eases off. Until the hedgies come in, what will happen is that price will move up to the point where the demand from the value based crowd gets choked off and loses some of its force.

The result is a market that has bottomed out but needs a shift in sentiment among the hot money crowd. With today's anemic GDP number, none of them are the least bit worried about inflation right now. Any doubts about that can be seen in the bond market price action as noted above.

The bulls did manage to take price through $1440, a level which earlier this week was attracting selling. When they then pushed it through $1450, traders who had sold against that level covered and that took it to $1470, another area that I was watching. Asian demand for the metal enabled buyers to take it another notch higher but as it moved into the mid morning of the Western session, the buyer just dissipated and short term oriented traders took that as a signal to close out some nicely profitable long positions recently established.


Notice how the volume LEAPS as the price drops. That is both long liquidation from day traders/short term guys and fresh shorting. The price action in the HUI, confirms that.

What we want to watch now is how gold acts as it nears the $1440 level. That level was serving as un upside barrier earlier this week and now reverses polarity and becomes a level of chart support. If gold can hold above this level, and so far it is,  it will give bulls some confidence to wade back in and will make a few of those brand new shorts reluctant to push their positions. We would then expect to see the metal move back higher and take another shot at resistance. I would want to watch both the volume and the price action were that to occur to see if this thing has a shot at $1500. Remember, it is still an intermediate term bear market in gold so until the technicals change, strength will be sold unless we get a violation of resistance and a shift in the momentum of this market.

Did anyone notice how the miners faded well off their highs late in the session yesterday even as the rest of the equity world was celebrating another back slapping day of further giddiness. That was another clue that the euphoria in gold was about to hit a temporary wall.

The HUI managed to claw its way back into the technically significant gap region I have previously noted, but as expected, it could not CLOSE THROUGH the GAP to end out the week. That must occur for this to kick up another leg higher. It did manage to close in the gap yesterday but the manner in which it faded out towards the end of the session forebode further downside today.


What does this translate to in terms of the gold shares from a technical perspective as a result? Same as gold - the market posture is decidedly bearish but it does appears as if a bottom is in. The sector is lacking a strong upside catalyst however at the present time. Value based buying is holding it up but the momentum based crowd is absent on the buy side. The result - sideways trade above support near 255 until or unless that gives way or the index pushes past the top of the gap just above 300.

By the way, the HUI to Gold ratio continues to drop.

One thing I am noting today is that the Gold Volatility Index is moving higher again. It had been falling as gold was moving higher reflecting the lack of concern about further price weakness of any sharp degree. With price having regained a very large portion of the overall price decline since key support at $1525 gave way, it looks as if there is some nervousness building on the part of players about some potential for some more downside. We'll see if that is correct or not.

Wednesday, April 24, 2013

HUI Showing some Signs of Stability

The mining shares are attracting value-based buying which is providing some signs of stability in this beaten-down sector. As mentioned many times on this site, it will require far more than value-based buying to take this sector strongly higher. For that to occur, it requires momentum based traders.

Just take a look at the broader equity markets and you can see what happens when these momentum buyers decide to chase prices higher.

While we might have stem the downside in the mining shares, this sector needs to prove itself technically in order to give some potential buyers the confidence that this is just not a pause before a new leg lower.

For that to occur, buyers will have to show enough conviction to take the index into the gap region shown on the price chart. They will not only need to spike it into that gap, but hold it there on a close for a bare minimum. If they can do that, it should give some bears second thoughts about hanging around excessively long and overstaying some successful trades in the mining sector.

A CLOSE above the top of the gap, near the 300 level, should bring in some momentum based buyers as it will induce some additional short covering.


I want to continue to reiterate the necessity of these mining shares to improve their technical chart pattern before the gold market can sustain any sort of extended move higher. The shares led the metal lower and more than likely they will lead the turn in the metal higher. I would also suggest monitoring holdings in the ETF, GLD, to see if investors are returning to gold.

Moving over to gold itself, I am detailing a 2 hour chart as it establishes some areas of technical interest for us. After the wild volatility of last week, we are finally seeing some signs of a market that is settling down and beginning to act in a more "civilized" fashion. By that I mean it is not swinging all over the place.

Along that line, the Gold Volatility Index, has been dropping also. It is currently trading near 21.80 after having spiked as high as 35. That confirms that the recent bout of volatility (emotional duress) is behind us for the time being.

Back to the chart - what concerns me about gold is that the strong physical demand has been able to spook some bears (Goldman cancelled its sell recommendation) but has not yet been enough to bring back those investment types that were flooding into the gold ETFs around the world and the mining shares.

The other question I have is whether or not this physical demand is going to keep up its torrid pace if prices continue to drift higher. Gold under $1400 was certainly cheap but will buyers around the globe see it that way if it climbs back towards $1470 or higher? That remains unclear.

What I believe is the more likely outcome of this is that a floor has been established in the gold market below $1390 but there is not enough investor type demand from large players to drive the market sharply higher. The outcome then is most likely a period of range bound trading with both sides looking to either sell rallies or buy dips depending on their bias towards the market.


Right now, the top of the range is near $1440. Selling is entering near this level and bullish enthusiasm is fading as the market moves higher based on the shrinking volume. With volume low, bears feel confident selling against this level since they have some wiggle room to play with the $1450 psychological level as a mental stop out point. That is a relatively favorable trade in their minds since the risk is small compared to the potential for a drift back towards $1400 and perhaps lower.

Bulls on the other hand will more than likely feel comfortable buying in near those same levels figuring that physical demand will be their ally. They do need to take the price through $1440 very soon or they are going to face some desertion in their army from the shorter term oriented day traders and scalpers.

As far as today goes, the strong pop in crude oil that has taken it above the $90 mark, along with a bit of strength across the commodity sector, most notably copper, is giving gold a boost, especially with a bit of weakness being seen in the US Dollar.

It is going to be very interesting to see if the Asian demand that we have been seeing overnight continues this evening. It cannot let up if the market is going to hold its gains especially with equities continuing their one way trip north. Blue Horseshoe apparently still loves equities and until he stops loving them, a great deal of that $85 billion from the Fed this and every month, along with that $74 - $76 billion from the Bank of Japan, is going to end up in equities instead of gold.


Tuesday, April 23, 2013

US Mint Temporarily Suspends Sales of 1/10 ounce Gold Coins

Newswires today are reporting that the US Mint has temporarily suspended its sales of 1/10 ounce gold coins due to the surge in demand. Apparently there are insufficient supplies of the coins to meet current demand. A spokesperson for the mint says that they will resume sales as soon as the Mint can strike enough of the coins to replenish inventories.

Next to the one ounce coin coins, the 1/10 ounce gold coins are the second most popular coins bought by those desiring to own gold.

Hacked Twitter Feed for AP sends Markets Careening

I view this incident as further evidence that the US equity markets are floating higher and higher on nothing but a bubble of air. Those who continue to chase stocks higher based on nothing but liquidity injections are playing a fool's game.

I look at today's one minute collapse in prices as a warning of what will happen to this market when all of these hedge funds who keep jamming these markets higher decide to stop buying. At some point, who in the hell are they going to sell to when the bell is rung???
Following is a 5 minute chart of the emini S&P 500 futures. If you happened to have gone to the bathroom just before the sharp selloff began, and came back and sat down in your chair in front of your quote screen, you would have seen prices pretty much right back where they were when you left. "Oh well, not much happening at this point" would have been your response. Boy howdy would you have been wrong.


Can you imagine how much money was lost today by traders on the long side of this market when those computers started selling and picked off every single downside sell stop?

Already you are hearing voices condemning the computers. Why is it that we only hear these voices when prices move sharply lower but the same voices are eerily silent while the same computers are busy buying everything in sight and shoving prices into the stratosphere? I only pose that question to point out the hypocrisy of those who seem to think that there is an ELEVENTH AMENDMENT to the US Constitution noting a God-given right to a permanently rising stock market.

My contention is that this madness we are witnessing in these markets, every single damned bit of it, can be attributed directly to the Fed and this incredibly stupidly short-sighted QE crap. A balance sheet of over $3 TRILLION and rising...

There is nothing fundamental behind this rise in stock prices - nothing - not when commodity prices continue moving lower and lower. Yet, someone keeps pushing it higher even as volume continues to shrink. This tells me that there is no sponsorship in this rally other than those who are AFRAID to SELL IT. That is leaving the air pocket overhead which can be hit by comparatively small buy programs.


Today, the reason cited for the move higher in the first place is that the news out of the Eurozone is so pathetic, that traders are just convinced Draghi is going to LOWER RATES and start their own version of the Fed and BOJ liquidity party. In other words, more funny money creation. This generation of stock investors/traders is collectively punch drunk.

Meanwhile, the markets bubble higher and higher - where they stop nobody knows. Place your bets ladies and gentlemen but you had damned well be first to pull the trigger on the sells if you expect to have much of anything left when this party stops. It is a TRADER's Market and not an INVESTOR's MARKET. Just remember that and you will be okay.


Saturday, April 20, 2013

Gold Commitment of Traders Explains surge in Open Interest

Many commentators have been confused by the recent open interest readings that we have been getting out of the CME Group detailing the movements of traders into or out of the gold futures markets. They have been looking at the huge increase and have been somewhat baffled at best and downright confused at worst.

While there is no doubt in my mind that it was a series of extremely large sell orders that got this downside ball rolling something else is going on that explains these open interest readings.

The usual pattern that we have seen in the gold market over the last decade-plus bull market has been a build up in the hedge fund long positions as they buy the market which is countered by the bullion banks and swap dealers taking the other side of that trade and going short. At some point, the market stalls in its upward momentum, a trigger occurs, and then the price reverses as the hedgies sell out or liquidate their long positions. This selling is then met with buying or the covering of shorts by the bullion banks and swap dealers.

At some point, the buying in the physical market becomes so large that it prevents any further downside price movement whereupon the market then stabilizes and the process repeats itself with price going on to make yet another high.

During these periods, many expect to see open interest shrinking as the price descends because it shows that many participants are reducing their positions - the hedge funds are getting out by selling previously established longs and the bullion banks and swap dealers are getting out by buying previously established shorts.

When open interest readings increase, it tends to confuse some as it seems to contradict the usual pattern that has become so familiar. What is leading to confusion is that the SPREAD POSITIONS of some of the LARGEST TRADERS are not taken into account.

I have graphed two of these categories for you to see and noted the price action in gold that occurred over this same period. The two categories are the SWAP DEALERS and the OTHER LARGE REPORTABLES.

This latter category includes the likes of CTA's (Commodity Trading Advisors), CPO's (Commodity Pool Operators), Large Locals from off the Pit Floor and other Large Private Traders. While these groups do not have quite the same impact as the enormous Hedge Funds, they are still large enough to affect trading.


Can you see the big spike higher in their spread positions back in August 2011, when gold shot up to $1924 and then collapsed all the way to $1535 before it stabilized? Now look at this past week's spike higher. See a pattern here? By the way, the sharp increase in the number of spreads put on by the Large Reportables Camp ( 87,178) was the largest single week increase for that camp on record. The increase in the Swap Dealers' Spread position (+49,768) was also a weekly record.

There is your REASON for the SURGE IN OPEN INTEREST.

There is a strategy behind this which I will not get into right now in detail due to time constraints ( soon coming attraction) but suffice it to say for now that it is an attempt first to get downside protection and cushion losses for those who are long and are on the wrong side. Second - the proper use of a spread position can be very advantageous to traders who can time the markets accurately enough to leg into and leg out off these spreads. It requires considerable skill however to pull this off and trading accounts large enough in size to allow for the jump in margin requirements as one leg of the spread is lifted.

IF we leave off the impact of these spreads in the overall open interest numbers, it would have only seen an INCREASE of +14,460 compared to the previous week. This was based on the bullion banks increase of both their long and short positions (which incidentally favored more longs at this point than shorts) and an increase in the SHORT positions of the small specs, the general public who sold down into what might turn out to be a hole. When we take into account the sharp increase in the number of spreads, we see a completely different picture with open interest increasing over 154,000 contracts this week alone.

Therein lies the "mystery" for the open interest readings for the past week. If gold stabilizes here and begins to base build, watch for these spreads to be drawn down.


Trader Dan Interviewed on King World News Markets and Metals Wrap

Please click on the following link to listen in to my regular weekly radio interview with Eric King over at the KWN Metals Wrap.

http://www.kingworldnews.com/kingworldnews/Broadcast/Entries/2013/4/20_KWN_Weekly_Metals_Wrap.html

Friday, April 19, 2013

Monthly Gold Chart

I wanted to see how this week's price action in gold would resolve itself so that I could do a bit of analysis on the market. Keep in mind that this is LONG TERM stuff. The nature of markets nowadays being what it is (they are run by hedge fund algorithms which do not think but just issue buy or sell orders automatically once certain trips are triggered) it helps to get a sense of where we are in the general scheme of things by looking at the larger picture to see if we can identify a long term trend.

I realize that the chart is cluttered but it needs to be in order to show the areas I have pinpointed that need some attention given to them. I have laid out TWO separate Fibonacci retracement patterns starting with the 2001 low and extending to the 2011 peak PLUS one starting with the 2008 low and running to that same 2011 peak up above $1900.


Then I have drawn in TWO separate pitchforks - one for use during the bullish phase and one for use during this now bearish phase.

I am interested in seeing the intersections between these various levels that are generated. Look at the area I have noted with an ellipse. It contains TWO Fibonacci retracement levels - the 38.2% retracement of the entire rally beginning in 2001 and the critical 50% retracement rally from the 2008-2011 rally. Can you see how those center around the $1300 level?

Now note the two pitchforks - the one uptrending, and the other downtrending and locate the intersection of the median or middle lines in both forks. Can you see how it come in right on top of the previously mentioned TWO Fibonacci retracement levels?

What does all this entrail reading denote? Simple - the area near and around the $1300 level is now critical for gold's fortunes as we move forward.  I believe it has as much significance as the former support zone back up near the $1525 region.

If this region fails for any reason, gold is going to fall first to $1200 and then possibly $1100 - $1092.  That would dovetail with the BEARISH FLAG FORMATION I have noted on a previously posted daily gold chart that would target another $200 drop if this week's low were to be violated on HEAVY VOLUME.

If the bulls can hold this market above this week's low but certainly above the $1300 level, then they stand a real chance of forcing a period of price consolidation or sideways movement. I believe it is too much to expect this market to ricochet sharply higher after the psychological beating that the bulls have received this past week.

While it is certainly encouraging to see the strong physical offtake that these lower prices are stimulating, it will require the return of the hedge funds to the long side of this market to take it sharply higher. for that to transpire, we must see fears of inflation displacing fears of deflation or slowing growth. Falling interest rates globally are showing that currently there exists no fear of inflation from Central Bank money creation at this point.

This week's Commitment of Traders report might be misleading to some because it shows Hedge Fund short covering occurring. Some might be tempted to think that they are abandoning the short side of the market. What needs to be understood is that gold plummeted over $200 in the matter of a couple of days. When it hit $1320, some shorts prudently booked some profits. The market then popped $40 off of that level. The next day, Tuesday, it fell back down to that $1320 level, but rebounded all the way back up towards $1400. That buying was SHORT COVERING on the part of the hedge funds. Once it showed that it was not going to break support, they rang the cash register on some short positions. They are however looking to sell rallies so they probably re-entered above $1400 during today's session (Friday).

We saw similar data in the COT for both silver and copper. Both of these metals showed that same short covering by the hedgies. In copper they covered some of their shorts below the $3.25 level on Monday and Tuesday. In silver, they covered some of their shorts on the steep fall towards $22. The trends in these metals are lower however and that means rallies will be sold by the speculative crowd dominated by the hedge funds.

To force some of these guys out of their short positions, it is going to take a concerted effort by the bulls to push price high enough to trigger their algorithms into buying. I am not sure where that catalyst might come from in the very near future. For starters I would need to see some sort of upside reversals in various commodity futures markets, notably copper and crude oil/gasoline and then the grains. In other words, the CCI would need to forge a bottom and show a definite upward turn with a trend change.

Fundamentally, we need to see a rise in real wages as well. Interest rates also would need to show a shift in the curve towards anticipation of inflation by the bond markets. They will pick it up long before the herd that looks only at equities figures it out.


Gold sees Strong Short Covering in Asia

Last evening here in the US, while watching the gold price action, it was evident that the reports of strong physical buying spooked a fair number of weak-handed shorts. In watching the price climb, once gold poked its head above $1400, but especially $1402 or so, the stops got hit and up she went. Volume picked up as the stops were continuing to fire, until the market ran out of steam up near $1425 where it began to retreat.

That was the high point for the session. Once trading moved into New York and the PM Fix was over, with India and the rest of Asia now closed, bears were able to take the metal down below $1400 again before the pit session closed. However, in the after market it has been floating back above $1400 once again.

I would have liked to see this thing hold onto a handle of "14" but at least it closed firm even though it was down some $106 for the week.

We have some technical chart points now to work with on this market. Support is in the zone noted extending down from $1365 and below while resistance is last evening's high near $1425.


A couple of things can be said about this chart. First, the more ominous news - the chart is displaying a near picture perfect BEARISH FLAG FORMATION. (That formation is shown in BLUE). If this market were to somehow break support on the downside after showing a pattern like this, it would portend the possibility of another $200 drop before all is said and done. I shudder to think what that would portend however for the global economy because it would signal that the Central Banks and their money spigots have failed completely in the battle against deflation. If that were the case, the stock markets globally would implode.

Having said that, based on the type of solid demand mentioned this past week, I find it very hard to believe that this week's support zone will not hold. Again, if it does not, we are all in for a world of serious hurt.

The positive news from the chart is that the market has gone down to this support zone THREE TIMES this week and on each and every visit down there, it has encountered more buying than selling! Bears surely want to break it lower but they could not.

The other thing is that the HUI showed some signs of life this week after getting the snot beat out of it nearly nonstop over the last two week period. If this index can manage to somehow claw its way back above the 300 level, I would feel much more confident saying a long term bottom is in on that chart. That remains a good ways above the current level however with its close just shy of 270 this week.

Again, I strongly believe that since the mining stocks led this market lower on the way down, they should be the first to turn if this market is going to head back up. Why? Because it will signify the RETURN OF INVESTMENT MONEY into this gold market.

Russell 2000 Bounces but Remains Weak

The Russell 2000, an index of smaller cap stocks, has been a pretty decent indicator of investors' sentiment towards the risk trade or the "improving global economy" trade.

It tended to outperform the broader market as stocks went on a maddening tear higher with the unleashing of the Fed's QE programs. Those combined with the ECB bond buying program in the Euro zone and now, the conjunction of the Bank of Japan's bond buying policy, had gotten investors in a tizzy to chase stocks higher no matter what the economic news was.

In a case of "Heads - I win" or "Tails - You lose" if the economic news was improving, stocks went higher on talk about the improving economy. If the economic news was bad, stocks went higher anyway because equity perma bulls could point to the lousy data as evidence that the QE programs would continue. Regardless, it was "BUY, BUY, and BUY"; no questions asked.

Suddenly, the bottom began to drop out of various commodity markets, most notably copper and of course gold and silver. But even crude oil and gasoline had been breaking down on their charts to the extent that the entire CCI, Continuous Commodity Complex has been swooning. There does come a point where even the most die hard stock bull has to start wondering how long his or her market can continue to levitate in the face of one piece of evidence after another that all is not well in La-La Land.

While we are seeing another miraculous recovery in stocks today, even as copper sinks further into bear market territory, that rally cannot hide the deterioration that is now solidly entrenched on the technical price charts.

Take a look at this Russell 2000 daily chart. It had fallen below the very important 50 day moving average early this month but managed to recover and rally back to near the recent high. Instead of attracting buying however, it began to attract selling. The result was a technical failure that has sent this index lower. This week, on Monday, the index broke firmly below the 50 day moving average again. After a feeble attempt at moving higher, it swooned on Wednesday and continued lower Thursday. Here, we are seeing what we have come to expect at this point on a Friday - the equity markets are miraculously saved from even more severe chart breakdowns just in the nick of time (PPT anyone?).


That being said, the index has now been trading below the 50 day moving average the entire week. The longer it stays below that average, the more likely it is going to break down further. I have noted two additional important moving averages, the 100 day and the 200 day. Notice that the horizontal support line I have shown in dotted red, come in exactly at the 100 day. That seems a logical target for this market at this point.

If this index falls below that level and cannot get back over it within the same week, I believe we are going to see a much more severe downdraft in the equity markets commence. What this will be telling us is that a growing number of stock investors will be turning bearish on equities even in the face of all this QE stimulus coming from both the Fed and the Bank of Japan. In other words, the investor world will be sending a signal that it no longer believes the bond buying programs are going to have any efficacy on creating any kind of serious growth!

Also note something that we have not seen in quite a while (early November of last year - remember when the "fiscal cliff" thing was all the rage), namely, the 50 day moving average is now turning lower. That bears watching.

Something else I have noted in my personal studies but will not post here is that the Homebuilders ETF, XHB, shows a chart pattern that is almost identical to this one. The same things that were said about the Russell 2000 apply to the XHB, it has been a strong performer to the upside as the housing sector has been seeing some signs of activity based on the availability of cheap mortgage money. If the housing market does roll over, this economy is in serious, and I mean serious trouble. I personally believe that this is what Dr. Copper has been forecasting.

This is the reason that I feel silver is having trouble even as gold has been showing good resiliency down here. The selling in copper is simply too much for the silver market (paper) right now as investors are selling base and industrial metals as they bet on slowing growth.

Today's Commitment of Traders report for copper shows the hedge funds still net short by a 2:1 margin. The report picked up the short covering among these big traders down below 3.25 on Monday and Tuesday but it did not catch the ferocious selling that hit this market the remainder of this week. My guess is that they went right back onto the short side in larger quantities again.

Thursday, April 18, 2013

CME to Launch New Mini Silver Contract in June

The CME Group announced today that they will be launching a new 1,000 ounce silver contract in June of this year. The September 2013 contract will be the launch contract.

As some of you may know, a full sized silver contract at the CME is 5,000 ounces.

The CME appears to be after some more smaller spec business. The interesting thing about this contract is that is will be fully fungible. That is a big deal if you ask me. If you accumulate FIVE of these smaller contracts, you can exchange them for one full sized contract.

I am going to be extremely interested to see how the volume and interest does in this contract. It might be a way that some of those who are interested in playing the silver paper game can get involved. Oftentimes, the extent of the price swings in silver and the relatively high margin rates can put the benchmark contract out of the reach of many smaller players.

I have not had time yet to see if a single contract will be able to be held into delivery. My guess is that it will require FIVE as I am unsure whether there are any 1,000 ounce bars at the warehouses that could be used to satisfy the delivery requirements any way.

Keep in mind, this is for trader primarily, not those who are only interested in the actual metal. One neat thing about this new size is that it might enable some smaller holders of the metal to hedge their holdings if they are expecting a period of price weakness....


Random Thoughts

Reports coming in from nearly all corners of the planet, but especially from Asia, continue to reveal massive buying of physical gold. Last evening, what was obviously a huge bear raid that occurred during the early Asian session, was repulsed by very large buying above the recent low.

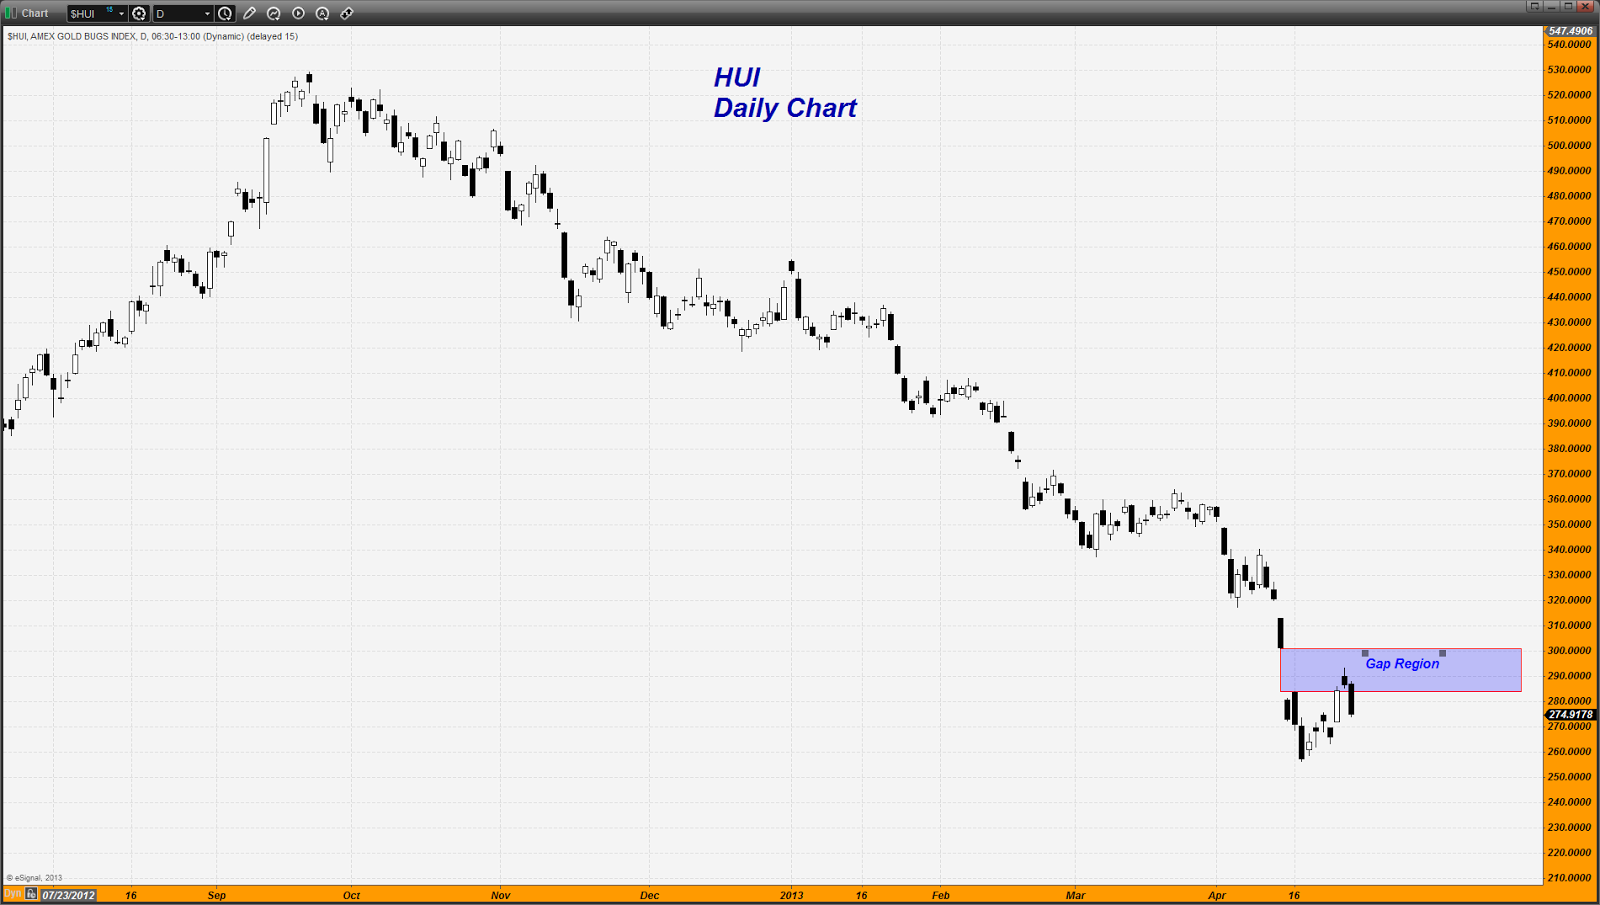
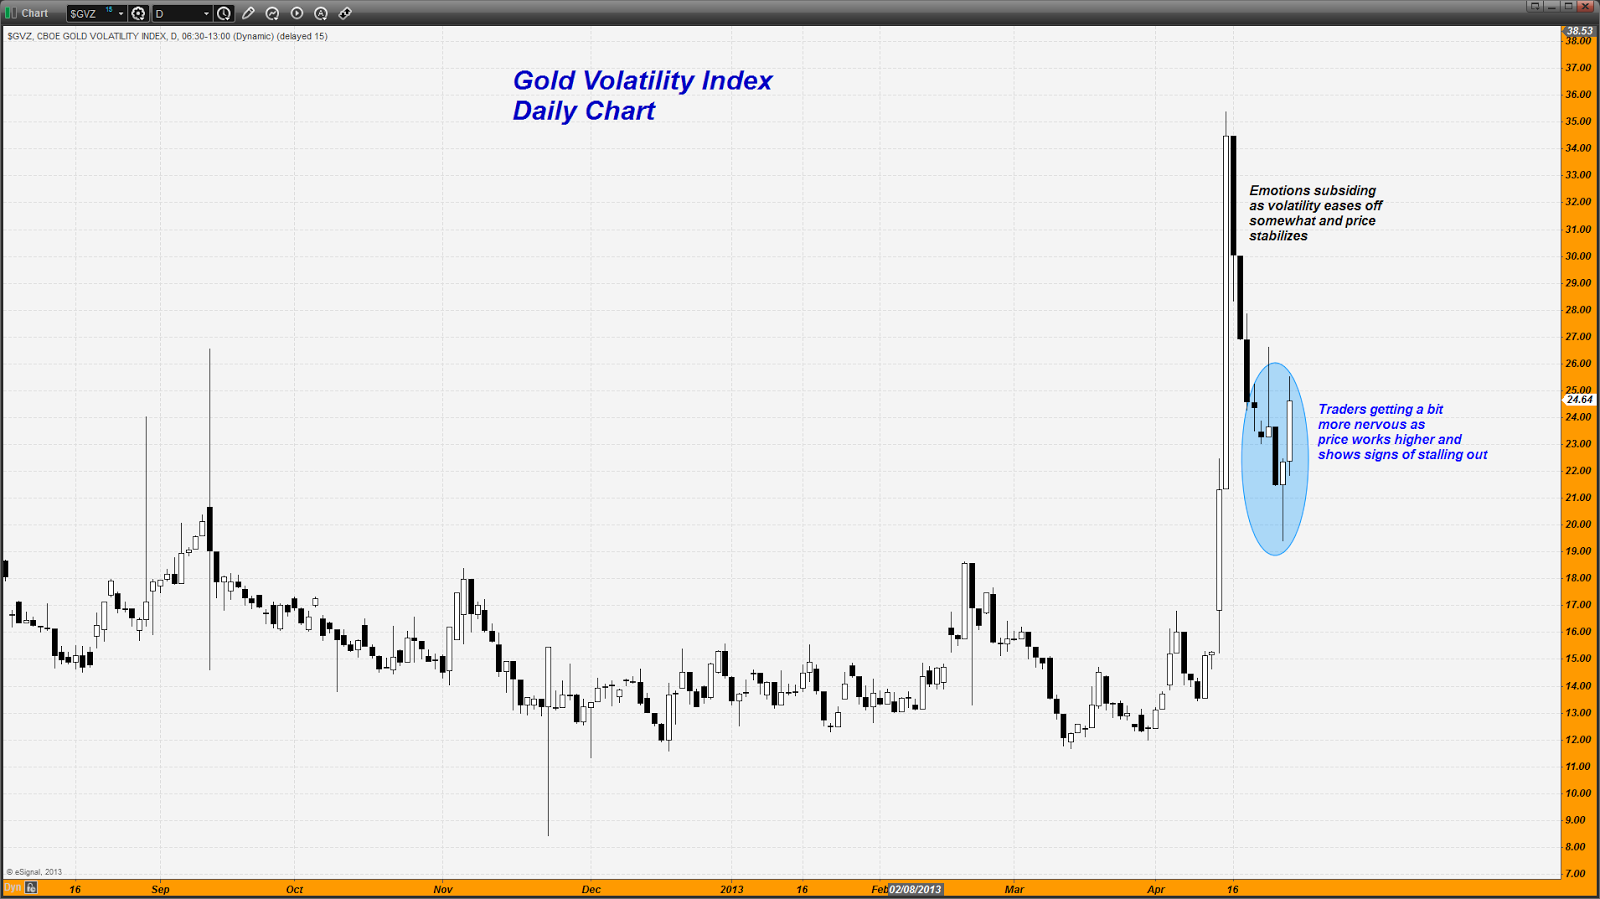
That is very interesting and has my attention. In a sense, we seemed to have gotten our second test of the low, a test in which that low held once again. With the wild price swings being made in this market, it is hard to be too dogmatic, but the way this market is acting, based on the news of strong physical offtake down near the $1350 level, I am greatly tempted to say that a low is in.

Here is what I am currently seeing here. We certainly have the strong demand for physical - the big question I have is whether or not this is sufficient to take the market higher WITHOUT the strong investment demand from the hedge fund crowd that we have seen for so many years. Remember, that crowd is selling right now in the paper markets.

What spooked a lot of the gold analysts were those speculative outflows from the gold ETF, GLD. There was also large scale buying of put options there as well. As a side note, I asked then and continue to ask now, who has been buying all that gold that was being sold out of the GLD?

So once again we are back to witnessing the same battle that we have seen for over a decade now - the clash between the physical gold market buyers and the selling of the paper markets by the hedge funds.

How this might translate to price action is a market that stops moving lower but also one in which it cannot scoot higher either. There is an uneasy truce between bull and bear. Bears cannot break it down any further based on the amount of physical offtake but bulls need more recruits to their side from the hedge funds to have any upside fireworks occur. Thus we move in a broad range between the recent bottom and $1400 on the top.

Obviously, for gold to now recapture any bullish excitement, the handle of "13"needs to be replaced by the handle of "14" at a bare minimum. If that occurs, we will see some short covering begin among those who have sold down below $1350. They are counting on fresh selling into rallies to support their side of the argument and if they suspect that their allies might be wavering, fear of larger losses will send some of the packing.

It will all eventually come down to CONFIDENCE. When enough people around the globe, begin to lose confidence in their own currencies (and bond markets) and the policy of their respective Central Banks, the gig will be up. The large physical buying of gold is evidence enough that a growing number of people are increasingly concerned about the health of their domestic currencies.

When will the paper markets begin to reflect that again? The answer is unclear; but I am convinced it will happen. Keep in mind that the current monetary system as we know it, and I am talking about Bretton Woods, is not even a century old. As flawed as that was, at least there was some place for gold in that system. Since 1971 however, the entire system has been supported by nothing other than CONFIDENCE.

In effect, we are a little over a generation (40 Years) in an EXPERIMENT by Central Banks with a monetary system held together by nothing but sentiment! Think about that for a moment and let it sink in. This is why I believe these monetary masters are pulling out all the stops to somehow keep the public from any sort of nervousness, concern or panic. Yet, in spite of all that, we keep getting hot spots that continue to flare up.

This brings me back to the paper markets -


 In the SHORT term the paper market can be used to push prices all over the place, sometimes disconnected from reality, because of the vast sums of money that are involved due to the proliferation of hedge funds who borrow gazillions of the stuff for next to nothing and then stuff it into various markets around the globe.

 
This gargantuan sum of hot money, every bit of which has been given to us by the Federal Reserve and the Bank of Japan, is a rolling juggernaut that crushes whatever is on the other side of it. Whether it is exiting a market or entering a market, its appearance produces all manner of price distortions, both on the way up and on the way down.

 
Eventually, the fundamentals reassert themselves however. They have to or the paper market ceases to be of any value in the real world whatsoever. Remember, there are thousands of commercial entities that must rely on that paper market to hedge both long and short positions as part of their overall risk management programs. Wild swings in price, disconnected from reality, destroy hedges put in place by commercial entities because MARGIN requirements, though lower for bona fide hedgers, still must be met EVERY SINGLE DAY at the settlement process.

 
A hedge position can thus be blown to pieces by this sloshing wave of speculator  activity requiring large margin calls and causing financial duress for a commercial hedger. This defeats the very purpose for which they employ the futures markets in the first place, THE MITIGATION OF RISK. The last thing any entity engaged in the use, production, selling, purchasing, etc., of any commodity wants is to stay up nights losing sleep over fears of an obliterated hedge position.

 
If the paper markets become so volatile and so disorderly, eventually these commercials will begin to look for other mechanisms to offset risk other than the futures markets.  This will reduce the size and scope of the commercial participants in these markets leaving them more and more to the speculators. The problem with that is that this crowd, thanks to the algorithms, tends to move to the same side of the market, meaning that there will be fewer and fewer large traders to take the other side of their trades. Can you even remotely imagine what that will do to market volatility and to the eye-popping, stomach wrenching price swings??? It will for all practical purposes, render many of these markets untradeable.

 
I will go on record here and now stating the NUMBER ONE SOURCE OF MARKET INSTABILITY is the zero interest rate policies of the Western Central Banks, (and the Bank of Japan). It is these institutions which have created this gigantic pool of hot money and who continue to increase it month after month all the while producing a near zero interest rate environment in which it is impossible to obtain a decent rate of return on investment capital for most people. This tsunami of hot money crashing ashore and then receding back only to crash ashore again and recede back out again, repeat ad nauseaum, ad infinitum, is what has given rise to the insanity that we now daily witness in the paper markets.

 
Rather than having a calming or stabilizing influence on the markets, the “masterminds” behind it have re-defined the world volatility. This wall of money is so fickle, so unwed to any deep-seated conviction, that it is a beast, a truly out-of-control behemoth that can easily devour the entire financial global system.
 
Just watch the extent of the price moves in various markets and tell me that this is "normal" behavior. Those of us who have been doing this for a long time can tell you that we can recall periods of extreme volatility but those periods were more or less exceptions from the norm. They tended to be of rather short duration and burned out quickly. What we have nowadays is apparently now the NORM and periods of relative quiet are the exception!
 
The Central Banks, in an attempt to prop up their rotten Dagon, are fighting furiously again the results of excessive debt by vainly trying to encourage more of it! They are attempting to counter the forces of deflation by employing what they can to foster the forces of inflation. This is the war that is raging in the financial markets and is why this volatility will be with us until one side or the other vanquishes its opponent.

 
Thank you Mr. Central Banker. Job well done. Keep telling yourselves how successfully your policies are working.


Wednesday, April 17, 2013

Global Interest Rates Plunging

Further evidence that the reflation schemes of the Western Central Bank are apparently failing can be seen in the collapsing yield across the global bond markets.

News out of Europe this morning that March Auto Sales fell to a TWENTY YEAR LOW has shaken the confidence of investors in the demi-gods manning the turrets of the Central Bank towers. It seems as if even the mighty German economy, which has heretofore been the stalwart among the European economies is not immune from weakness.

Dow Jones is reporting that the Swedish Central Bank just cut that nation's growth outlook for 2014. The Bank of Canada lowered its forecast for this year. Remember, it was just yesterday that we received the projections from the IMF detailing their prognosis for global growth by revising it lower as well.

The result - a mass exodus out of stocks (for the time being) and back into the "safety" of sovereign debt. Investors figure that the Central Banks will be there to mop up any excess supply of bonds in effect watching their backs for them.

Need some evidence? Look at the chart below. The yield on the Ten Year Treasury note has hit a FOUR MONTH LOW in today's session. It was over 2% a little over a month ago and is now down below 1.7%.


This is what has Fed governor Bullard so concerned. These guys can read what is happening. It is also why copper and crude oil, two key economic barometers continue to plunge.

What will the Central Banks do if they current bond buying programs still cannot generate enough consumers/businesses to borrow and spend????

By the way,  I laid out the data in this format because this type of chart tends to cut through the "noise" and give a cleaner view of the larger trend.


Federal Reserve's Bullard: Worried that Inflation is too Low

That is the headline on one of the Dow Jones newswire this AM.

Bullard is head of the St. Louis Federal Reserve Bank (that is the one with all those nifty databases by the way on economic statistics).

He made a comment about the Personal Consumption Expenditures Price Index or PCE as it is commonly referred to and noted that he was concerned about it "running very low."

I have to give credit to Mr. Bullard when he noted that the Fed is limited in its ability to impact the labor market. He said that is best left to labor market policies themselves.

Bullard appears to be uncomfortable with the Fed's  focus on the unemployment number as a target for its bond buying programs.

I bring this up this AM because Copper is breaking down and entering Bear market territory while Crude Oil and gasoline prices are also weak. We will want to keep an eye on that.

Grains are also mixed this morning with the exception of new crop corn that is up over planting delays ... completely unwarranted in my view... associated with the cooler than normal weather in the Midwest, and some strength in wheat. Market participants are constantly underestimating the ability of the US farmer to get a crop in the ground. They will plant in the dark if they have to.

Gold is showing strength at this juncture however as it appears the growing number of reports detailing extraordinary demand for the metal, particularly overseas in Asia, are perhaps making some bears a bit less aggressive this morning. Truth be told, I do not like to see markets pop like this without retesting the recent lows. Spiking bottoms make risk/reward decisions very difficult. Better to see the market move lower and see whether it uncovers more selling or more buying on the way back down. That is a much better signal.

The problem for gold today remains what it has been seemingly forever now; the gold shares are continuing to sink lower stretching that HUI-Gold ratio to nearly cosmic proportions. Something is going to need to give here fairly soon. Either these gold stocks are going to bottom or the price of gold is going to have to move lower yet.

When you are knocking on levels seen at the very inception of a generational bull market ( it began in 2001 - the ratio is at the exact same level now as it was then), something is amiss. Keep in mind that the ratio at that time was at a low because gold was coming out of a TWENTY YEAR BEAR MARKET that began back in 1980 after it peaked out near $850. Here we are after a decade plus BULL MARKET and already the ratio is down at the same level it was at the end of a TWO DECADE BEAR MARKET. That makes no sense to me whatsoever in just thinking about it.

I am not sure what the market is saying about some of these mining shares but one has to wonder if we are going to soon see some very big changes in that industry.

Incidentally, the US DOLLAR is on the receiving end of safe haven flows today with the Euro, the Pound and Swissie all sharply lower. The commodity currencies are also weak with the Yen coming well off its overnight lows as it too continues to get those safe haven flows for some bizarre reason that I will never be able to understand.

Silver is holding up better than I expected given the sharp down day in the Copper market but it seems to be getting some support from the resilience in gold this morning.


Tuesday, April 16, 2013

Long term Gold Chart

In attempting to discern a stopping point for this decline in gold, the best we can do is to take a look at the longer term chart. The extent of the selloff has been so swift, so severe, and unprecedented in terms of my own experience based on the percentage decline, that one would expect the selling to have played itself out for the time being. This does not mean that we should expect one of those "V" bottoms and an immediate resumption of the uptrend. Rather, I think what we will see is an intermediate bottom followed by a trading range as gold trader/investors attempt to ascertain what we can expect next.

From all the reports that I have been reading last evening and today, gold coin and bullion demand is soaring. A report on Dow Jones last evening remarked about the surge in demand from some of the bullion dealers in Singapore. Further stories about gold coin demand continue to appear today. The break in price has attracted a significant number of purchases by those scooping up what appears to them to be bargains.

Also, some industry analysts have been tossing around the number of $1300 as a sort of breakeven cost for the general gold mining industry. The thinking is that if prices were to move down below that level, mines would be sold off, closed down, etc. which would eventually begin to impact supply moving forward. Of course that is a much longer term perspective for short term oriented traders but it does go to show that at some point, the best cure for low prices, is indeed, low prices.

What remains to be seen is whether or not this strong physical demand can offset money flows of hedge funds out of gold and gold related items such as mining shares which are managing only the most feeble of bounces in today's session. The result has been that the ratio of the HUI - Gold price is now down to levels that it has not seen since April 2001, almost at the very beginning of the decade + bull market in gold. That is simply stunning.

My contention - until these pathetically weak gold mining share stocks begin to show some signs of life, it is going to be difficult for bullion to mount any sustained rally here in the Western trading session hours. Too many people here look at these shares as a forward indicator of where gold prices are going and trade accordingly. If they see sustained weakness and only the most feeble of bounces in price in the mining sector, they are going to sell gold rallies with impunity since in their minds, they have absolutely nothing to fear.


 Take a look at the following long term monthly chart of gold to get a sense of where we currently are. I have drawn in two different sets of Fibonacci Retracement levels, the first of which takes the entire rally beginning back in 2001 to the peak up near $1900 into account; the second which uses as its starting point, the 2008 level made during the depths of the credit crisis.


Note that gold has moved down very near the 50% retracement point of that entire rally off the 2008 low that came in close to the $700 mark. The HALFWAY point on any rally, is a major chart technical level. On this chart it hits at $1310. Gold made an overnight low near $1320 which is close enough for dirt work.

It makes some technical sense that it held at that point. 
If you look closely, you can see that BELOW that level, there is the 38.2% Fibonacci retracement of the rally that began in 2001. That level is near $1280. If gold were to be unable to hold above $1310, odds would favor it dropping down to this level.

I have also drawn in an Andrew's pitchfork. I know some guys like to use them on an intraday or shorter term basis; I personally do not. However, they have some value in my view for the longer term, bigger picture charts, particularly if their various lines happen to coincide with the Fibonacci points or horizontal support and/or resistance levels.

If you look at that big ugly black bar sitting on the chart for this month, you can see that the median line crosses it very near the 38.2% retracement level of the 2008 low (the dotted line in purple). That level is $1454.

What I would need to see to indicate at least the chance of some sort of turning point in this market, is a combination of strength in the mining shares AND a push through at least the $1454 level. That is doable but only if we see something to spark inflation fears on the part of market participants. The notion du jour is that the Central Banks have killed inflation in spite of their money creation binge. That will need to change, and we need to see some data that suggests it is changing, namely VELOCITY OF MONEY, to dissuade the broader investor world that inflation is upon us.

I was looking at some data on the wage growth today that pretty much sums up what the problem is for gold right now.... REAL EARNINGS, that is, wages adjusted for inflation rose a paltry 0.3% in March from a year ago. While that is up a tad the data revealed that they are down from 2008! In other words, real wages have gone nowhere since the credit crisis nearly FIVE YEARS AGO.

Some further analysis by Dow Jones on this data reveals something even worse, the peak was way back in 1973! That is a GENERATION ago! 

This is the problem - consumers are not gaining any purchasing power in real terms. They are being forced to raid their savings or retirement accounts or use their credit cards and head deeper into debt to try to maintain their standard of living. Some were once using their houses as virtual ATM machines by refinancing at successively lower and lower rates and taking the cash saved and spending that on "stuff". How long can a generation continue to do that, Fed policy or no Fed policy?

This is why I think and will maintain, no matter how high this equity market eventually goes, that it is nothing but an enormous bubble pumped up by reflation efforts of the Central Bankers. It is not build on a solid foundation but on a shifting house of sand. Again, as a trader I have to go with the tape and play the cards dealt me, but as someone watching this lunacy unfold before my eyes, I have to speak out against it as monetary madness.

Wall Street currently cares nothing about any of this. All it knows is that $85 billion a month is being alchemized out of air and fed into equities. Nothing else matters - terrorist attacks, increasing poverty, falling real wages, soaring food stamp participation rate, mediocre job creation, increasing government indebtedness, IMF reports about predicted slower growth in 2013 for the Euro zone in general, slower than expected growth in China, etc. Nothing!

Pavlov's dogs were so well trained that they salivated every single time a bell rang, food or no food. The Fed has so well trained the hedge fund community that they salivate every single time they see any dip in price, whether it is large or it is small; in they come with the buy programs. And why not? They keep getting rewarded for their behavior so they will continue to do so until they stop getting rewarded. Case in point - the S&P 500 has now managed to take back 2/3 of the losses from yesterday... Meanwhile, the gold stocks keep moving lower and lower and lower....

Oh by the way, don't forget, that we will also need to see the action in the bond spread market along the curve to suggest inflation concerns are mounting. So far, nothing doing there either.

What I am saying is that while it is certainly nice to see at least one day in which the enormous selling has finally let up some, gold has some serious obstacles ahead of it to convince those who have been very badly burned by this metal, that it is okay to come back into the water and get wet once again. For now, it is a spurned lover with competition from the younger, hotter, woman - the US equity markets.