This afternoon, Eric King of King World News interviewed me to get my thoughts on the day's market action. You can read that interview in its entirety by clicking on the link below.
http://kingworldnews.com/kingworldnews/KWN_DailyWeb/Entries/2012/3/6_Norcini_-_Gold_%26_Silver_Smashed_as_Bullion_Banks_Cover_Shorts.html
Tuesday, March 6, 2012

HUI down but bounces from support
Once again the HUI has managed to attract significant buying down at the lows signifying that the same buyers who have been busy accumulating gold shares for the better part of the last year are still apparently willing to add to their holdings on these dips lower in price. As long as this index closes the week ABOVE that lower red line, we remain within a range trade.


Has the S&P 500 topped out for now?
The S&P 500 wiped out three week' worth of gains in today's session plunging through several support levels on the price chart. On the way higher, the level near 1350 had been serving as selling resistance and held the rally in check until it finally managed to break through that level three weeks ago. Today, the former resistance level, now turned support, failed to hold the decline in check.
I have set the chart in a KAGI Format as it is a better style in which to locate various chart resistance and support levels in my opinion. You can see the significance of 1350 rather easily as well as 1362 - 1365.

When using this chart format to analyze a market in an uptrend, the RED LINES, which indicate sellers are dominating, should hold WITHIN THE LENGTH OF THE BLACK LINES. The latter refer to periods when the bulls are in command. Notice since December of last year, this has been the case. One can clearly see the impact that EXPECTED LIQUIDITY supplies from the Central Banks has had on this market since that time period.
This looks like the first REAL CHINK in the armor of the bulls in some time. If they are able to immediatey halt the decline and take price back through 1350, they will have dodged a bullet and will be able to talk up today's selloff as just another reaction in an ongoing bullish trend. If not, the odds will favor a deeper decline with a drop down towards the 50 day moving average near 1320 should the next layer of support near 1342 - 1340 fail to stop the bleeding. Were this last level to give way on a closing basis, the red line would drop below the last BLACK LINE and signal additional selling should be expected.
Let's see whether or not the market has factored in a worse case scenario regarding Greece and a China slowdown or whether there is yet another shoe to drop. The verdict is therefore still out but one thing is certain - the onus is on the bulls to perform right away.
I have set the chart in a KAGI Format as it is a better style in which to locate various chart resistance and support levels in my opinion. You can see the significance of 1350 rather easily as well as 1362 - 1365.

When using this chart format to analyze a market in an uptrend, the RED LINES, which indicate sellers are dominating, should hold WITHIN THE LENGTH OF THE BLACK LINES. The latter refer to periods when the bulls are in command. Notice since December of last year, this has been the case. One can clearly see the impact that EXPECTED LIQUIDITY supplies from the Central Banks has had on this market since that time period.
This looks like the first REAL CHINK in the armor of the bulls in some time. If they are able to immediatey halt the decline and take price back through 1350, they will have dodged a bullet and will be able to talk up today's selloff as just another reaction in an ongoing bullish trend. If not, the odds will favor a deeper decline with a drop down towards the 50 day moving average near 1320 should the next layer of support near 1342 - 1340 fail to stop the bleeding. Were this last level to give way on a closing basis, the red line would drop below the last BLACK LINE and signal additional selling should be expected.
Let's see whether or not the market has factored in a worse case scenario regarding Greece and a China slowdown or whether there is yet another shoe to drop. The verdict is therefore still out but one thing is certain - the onus is on the bulls to perform right away.
Huge Exodus out of RISK TRADES in Today's session
Hedge funds algorithm's are going beserk on the sell side today with the result that most of the commodity futures markets are getting slammed lower. There are very few exceptions to the selling with Soybeans, Cocoa and Natural Gas are the few commodities holding up.
The metals are getting hit particularly hard with both silver and gold violating downside support levels on the charts. As can be expected, gold is holding much better than silver in a risk aversion environment.
Once again the catalyst for all of this is the situation involving the Greek debt bailout plan. Markets are worried that things are not going as the central planners were hoping.

The metals are getting hit particularly hard with both silver and gold violating downside support levels on the charts. As can be expected, gold is holding much better than silver in a risk aversion environment.
Once again the catalyst for all of this is the situation involving the Greek debt bailout plan. Markets are worried that things are not going as the central planners were hoping.

Monday, March 5, 2012
Silver clinging to Support at $34
Risk off trades were in vogue today after news came out that China reported that expected growth in their economy would be slowing a bit. That was all that was needed to bring out the sellers in both the equity and commodity markets.
Silver fell below pyschological round number support at $34 but then recovered, only barely, by the end of the trading day. It is clinging to support above this level as I write this.
There is a band of stronger support as one drops down towards $33 which will be tested unless the market can keep its footing above $34.
It is still trying to repair the technical damage inflicted from last Wednesday's bear raid which forced an outside reversal pattern on the daily chart. Thus far this selling that we are seeing seems to be drying up as it does move below $34 but any further negative global economic news will see that selling reappear once again.

Gold dropped below $1700 at one point but value buying took it back above this level. Just as with silver, it is going to have some work to do in order to repair the technical damage it suffered last Wednesday. Chart painting is more effective in these modern markets because very few fundamentally based traders are still around anymore. Alan Jackson had a terrific hit song entitled, "GONE COUNTRY" which contains a line that says: " the whole world's gone country". Well, the whole world has gone technical analysis when it comes to trading. Therefore chart painting has to be respected for the technical signals its gives off. Value based traders can still take advantage of this but they need to be careful.

There seems to be a bit of a tug of war between those who are reading the recent US ECONOMIC DATA as encouraging and those who are looking at a recession in the Euro Zone coupled with slowing Chinese growth prospects eventually spilling over into the US. We will see which side wins out in this battle - the bonds were even conflicted today - first rising on the slowing growth news and then sinking lower to close the day as the equity market recovered from its worst levels of the session.
Not too much definitive to say therefore until we get a clearer picture.
Silver fell below pyschological round number support at $34 but then recovered, only barely, by the end of the trading day. It is clinging to support above this level as I write this.
There is a band of stronger support as one drops down towards $33 which will be tested unless the market can keep its footing above $34.
It is still trying to repair the technical damage inflicted from last Wednesday's bear raid which forced an outside reversal pattern on the daily chart. Thus far this selling that we are seeing seems to be drying up as it does move below $34 but any further negative global economic news will see that selling reappear once again.

Gold dropped below $1700 at one point but value buying took it back above this level. Just as with silver, it is going to have some work to do in order to repair the technical damage it suffered last Wednesday. Chart painting is more effective in these modern markets because very few fundamentally based traders are still around anymore. Alan Jackson had a terrific hit song entitled, "GONE COUNTRY" which contains a line that says: " the whole world's gone country". Well, the whole world has gone technical analysis when it comes to trading. Therefore chart painting has to be respected for the technical signals its gives off. Value based traders can still take advantage of this but they need to be careful.

There seems to be a bit of a tug of war between those who are reading the recent US ECONOMIC DATA as encouraging and those who are looking at a recession in the Euro Zone coupled with slowing Chinese growth prospects eventually spilling over into the US. We will see which side wins out in this battle - the bonds were even conflicted today - first rising on the slowing growth news and then sinking lower to close the day as the equity market recovered from its worst levels of the session.
Not too much definitive to say therefore until we get a clearer picture.
Sunday, March 4, 2012
US Dollar compared to Comex Gold Chart
The chart I am presenting is due to a special request from a reader that I put one together. It is an interesting method of seeing in visual form the steady decline in the value of the US Dollar against Gold.
A careful inspection of the chart will reveal that there are certain periods during which the price of gold has moved higher while at the same time the US Dollar index was moving higher. It is during those intervals when the gold price has risen strongly when priced in terms of the various major world currencies that comprise the USDX.

The following chart is a picture of America's decline. As much as it deeply saddens me to say it, the US Dollar chart looks absymal.

A careful inspection of the chart will reveal that there are certain periods during which the price of gold has moved higher while at the same time the US Dollar index was moving higher. It is during those intervals when the gold price has risen strongly when priced in terms of the various major world currencies that comprise the USDX.

The following chart is a picture of America's decline. As much as it deeply saddens me to say it, the US Dollar chart looks absymal.

Saturday, March 3, 2012
Trader Dan on King World News Weekly Metals Wrap
Please click on the following link to listen in to my regular weekly radio interview with Eric King on the KWN Weekly Metals Wrap.
http://tinyurl.com/7u3mq82
http://tinyurl.com/7u3mq82
Friday, March 2, 2012
Bonds and other assorted topics
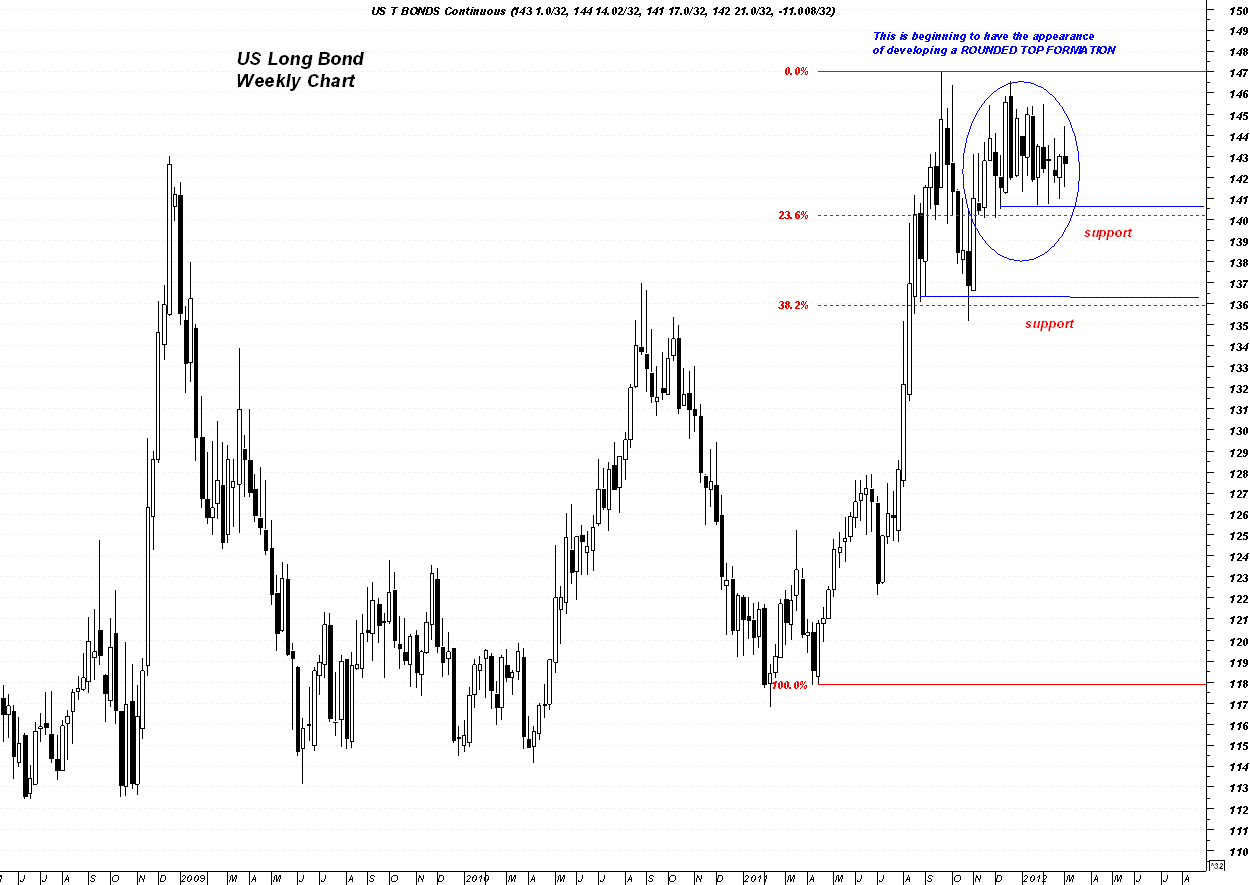
Please see the following charts for some comments on the US long bond market - in my opinion this is the SINGLE MOST IMPORTANT MARKET ON THE PLANET.

The weekly chart is very interesting as it shows a market that has the POTENTIAL (not there yet) to be developing a ROUNDED TOP FORMATION. That pattern is an especially reliable one because it indicates a SLOW but STEADY SHIFTING OF SENTIMENT occurring over a generally longer period of time as the realization slowly dawns on traders that the fundamentals are shifting in the other direction. This formation will not be validated unless we get a strong breach of downside support.
I have noted two of the nearest Fibonacci Retracement Levels where support for the bonds might arise. These areas will bear watching if for some reason the Federal Reserve cannot sustain its "PROP UP THE BONDS" operation.
DO NOT FORGET - the one thing most dreaded by the Fed in addition to the US Treasury Department is rising long term interest rates because of the mathematics involved in servicing the gargantuan and disgustingly pathetic level of US debt. Interest payments on the US debt are going to be consuming a larger and larger share of future government revenues in the months and years ahead. At some point, it will break the back of our nation. Thus the necessity of the Fed playing around in that market artificially suppressing the rate of interest at the long end of the curve.
I am strongly of the opinion that this reason was the SINGLE LARGEST DETERMING FACTOR behind Wednesday's orchestrated hit of the commodity sector and particularly the precious metals. Bernanke and company have categorically and continually dismissed all critics of their near-zero interest rate policy as engendering inflation by dismissing those concerns with statements to the effect that inflation is "modest, contained, temporary, etc."
They must continue this charade if they are to keep the bond market from collapsing to the downside with the subsequent onset of a rising interest rate environment. Bond traders have thus far been prevented from aggressively pushing on the short side of this market due to direct Federal Reserve involvement in that market. Should there be any shift towards an inflation bias that takes hold among those who trade or hedge in this market, those forces would overwhelm Fed efforts to artificially push it higher (yields lower).
A rising gold price strikes at the very heart of their supposition that inflation is subdued and there are little if any consequences arising from a policy that by its very nature is one which debases a currency. That is why this messenger (gold) must be discredited if the FED itself is to RETAIN ANY CREDIBILITY.
To witness a $100 drop in the price of gold within a few hours time and to have it explained by analysts who should know enough about market action to explain it as "disappointment in the lack of an imminent QE3" is laughable were it not so utterly wrongheaded. As stated in Wednesday's column, the Fed must not have commodity prices surging higher while they pursue a policy that has never failed to weaken or undercut the "value" of any currency whenever or wherever it has been plied.
When the Fed gives the hedge funds the green light to shove Equity prices higher after promising no hikes in interest rates until the latter half of the year 2014, they "expect" the hedge funds to be "well behaved" and not to jam a goodly portion of that hot money as well into commodities but rather direct their fire power into the equity world at which point the politicians and monetary authorities can bask in the accolades of the vast majority of what has become a dumbed-down citizenry who think that a rising stock market signifies a healthy economy.
Most distressingly to the Fed, the hedgies are not being compliant servants but had the audacity to chase the commodity complex higher and begin pushing not only energy but food prices higher once again, not to mention the bellwether metals complex. Were that to continue unabated, the bond market, which was crushed on that Wednesday and then on Thursday, would see buying support beneath it evaporate. Hence a pause or a time out was necessitated in the commodity complex rise which the Fed managed to secure by week's end based on the CCI.

Stay tuned as we are witnessing what I am coming ever more strongly to believe is the end game for this horrible experiment gone awry.

The weekly chart is very interesting as it shows a market that has the POTENTIAL (not there yet) to be developing a ROUNDED TOP FORMATION. That pattern is an especially reliable one because it indicates a SLOW but STEADY SHIFTING OF SENTIMENT occurring over a generally longer period of time as the realization slowly dawns on traders that the fundamentals are shifting in the other direction. This formation will not be validated unless we get a strong breach of downside support.
I have noted two of the nearest Fibonacci Retracement Levels where support for the bonds might arise. These areas will bear watching if for some reason the Federal Reserve cannot sustain its "PROP UP THE BONDS" operation.
DO NOT FORGET - the one thing most dreaded by the Fed in addition to the US Treasury Department is rising long term interest rates because of the mathematics involved in servicing the gargantuan and disgustingly pathetic level of US debt. Interest payments on the US debt are going to be consuming a larger and larger share of future government revenues in the months and years ahead. At some point, it will break the back of our nation. Thus the necessity of the Fed playing around in that market artificially suppressing the rate of interest at the long end of the curve.
I am strongly of the opinion that this reason was the SINGLE LARGEST DETERMING FACTOR behind Wednesday's orchestrated hit of the commodity sector and particularly the precious metals. Bernanke and company have categorically and continually dismissed all critics of their near-zero interest rate policy as engendering inflation by dismissing those concerns with statements to the effect that inflation is "modest, contained, temporary, etc."
They must continue this charade if they are to keep the bond market from collapsing to the downside with the subsequent onset of a rising interest rate environment. Bond traders have thus far been prevented from aggressively pushing on the short side of this market due to direct Federal Reserve involvement in that market. Should there be any shift towards an inflation bias that takes hold among those who trade or hedge in this market, those forces would overwhelm Fed efforts to artificially push it higher (yields lower).
A rising gold price strikes at the very heart of their supposition that inflation is subdued and there are little if any consequences arising from a policy that by its very nature is one which debases a currency. That is why this messenger (gold) must be discredited if the FED itself is to RETAIN ANY CREDIBILITY.
To witness a $100 drop in the price of gold within a few hours time and to have it explained by analysts who should know enough about market action to explain it as "disappointment in the lack of an imminent QE3" is laughable were it not so utterly wrongheaded. As stated in Wednesday's column, the Fed must not have commodity prices surging higher while they pursue a policy that has never failed to weaken or undercut the "value" of any currency whenever or wherever it has been plied.
When the Fed gives the hedge funds the green light to shove Equity prices higher after promising no hikes in interest rates until the latter half of the year 2014, they "expect" the hedge funds to be "well behaved" and not to jam a goodly portion of that hot money as well into commodities but rather direct their fire power into the equity world at which point the politicians and monetary authorities can bask in the accolades of the vast majority of what has become a dumbed-down citizenry who think that a rising stock market signifies a healthy economy.
Most distressingly to the Fed, the hedgies are not being compliant servants but had the audacity to chase the commodity complex higher and begin pushing not only energy but food prices higher once again, not to mention the bellwether metals complex. Were that to continue unabated, the bond market, which was crushed on that Wednesday and then on Thursday, would see buying support beneath it evaporate. Hence a pause or a time out was necessitated in the commodity complex rise which the Fed managed to secure by week's end based on the CCI.

Stay tuned as we are witnessing what I am coming ever more strongly to believe is the end game for this horrible experiment gone awry.
Subscribe to:
Posts (Atom)