I ran the data series from this index, which is supposedly one of the favorites that the Fed likes to monitor, to see if we could detect any sort of pattern. Here is the chart going back to the beginning of the data series near 1960. I took the numbers and converted them to an annual percentage change from the previous year and then plotted that on the chart. By the way, this particular data series excludes food and energy prices. When those are included, the changes are far more volatile.
Here is the same data set INCLUDING FOOD and ENERGY prices. Notice how much more dramatic the charts becomes. As a matter of fact, using this data set, one can see that the result of the credit crisis that erupted in 2008 actually led to the first DECREASE in price rises since the beginning of the data set!
If you are like me, I was immediately struck by the sharp jump that occurred in this series during the 1970's. Some of you will recall that was the era during which gold embarked on its previous massive bull market.
From its peak in that period, the index then moved lower, with a few, rather brief period of exceptions. This just so happened to coincide with a 20 year bear market in gold. Note then in 1999, the index moved higher and shifted into more of a uptrending pattern. I find it no coincidence that gold then embarked on its next massive bull market higher bottoming in price that very same year.
Here is a closer look at the same chart this time starting from 1999.Do you see what happened after 2008? The index fell sharply. Even though prices did increase then increased at a slower rate than anytime during the lifetime of the data series. Remember that was the year that brought us the eruption of the credit crisis and the subsequent massive deflationary impact across not only the US economy, but the entire global economy.
Enter Quantitative Easing....Look at what this policy produced in the index beginning in 2009. Price appreciation began to increase at a faster clip once again. It is interesting to overlay the gold price chart over this index during this same time period.
More to the point, the index registered another very small annual percentage increase in 2013. Prices in general were falling or flat. What was gold doing during this time frame? why it was falling... not unexpectedly at all based on what prices in general were doing.
While this index does not march in perfect lockstep with the price of gold, it is however rather revealing in that sharp moves higher in the chart tend to coincide with sharp moves higher in the price of gold while sharp decreases in the index tend to coincide with periods of lower or stagnant gold prices.
That is why I am keenly interested in what this index will be doing over the next few months/quarters. Are we entering a period during which upward price pressures will be the norm or will we see stagnant prices? Who can say at this point. Emerging market issues have the potential to put downward price pressure on commodity prices should they flare up further. Would that be a hiccup, a bump in the road, or would it be a more ominous occurrence that could produce a more widespread and enduring result? Those are questions that we are all going to get answers to in the months ahead.
In the meantime however, please understand that a fall in the gold price is far more complex than the simplistic notion that it is under attack by the powers that be. That concept has been a favorite face saver employed by too many in the gold community to justify their flagrant misreading of a market and their inability to come to terms with the simple fact that a period of falling prices (deflationary wave) does not favor an upward move in the price of gold.
Gold does not move in a vacuum. If anything, the above index provides us a bit more of a glimpse into the many factors that go into establishing a price for the yellow metal. Investor appetite for risk, currency factors, safe havens, overvalued/undervalued issues, geopolitical uncertainty, confidence, physical jewelry demand, etc... all contribute towards the price of gold.
Trying to get a handle on all of these various inputs is not an easy task. For one reason - who among us is wise enough to be able to process all of these various inputs and arrive at a price target that takes them all into account? Answer - no one. That is why I prefer to use the price charts and the action of the metal. More than anything else, it is a perfect synthesis of these various factors and how they are at work in creating money flows either INTO or OUT OF gold.
"When misguided public opinion honors what is despicable and despises what is honorable, punishes virtue and rewards vice, encourages what is harmful and discourages what is useful, applauds falsehood and smothers truth under indifference or insult, a nation turns its back on progress and can be restored only by the terrible lessons of catastrophe." … Frederic Bastiat
Evil talks about tolerance only when it’s weak. When it gains the upper hand, its vanity always requires the destruction of the good and the innocent, because the example of good and innocent lives is an ongoing witness against it. So it always has been. So it always will be. And America has no special immunity to becoming an enemy of its own founding beliefs about human freedom, human dignity, the limited power of the state, and the sovereignty of God. – Archbishop Chaput
Trader Dan's Work is NOW AVAILABLE AT WWW.TRADERDAN.NET
Monday, February 17, 2014
Sunday, February 16, 2014
Velocity of Money still Falling
Granted the most recent data ( Oct 2013) shows the key indicator still falling, we are still waiting for the January 2014 numbers. They should be available soon and then we might see whether or not Velocity of Money ( M2) is picking up as of yet.
Here are some additional charts detailing EXCESS Reserves of Depository Institutions
One more chart - this one details Total Reserve Balances. Here is what the note on the one of the Fed's websites states:
This item includes balances at the Federal Reserve of all depository institutions that are used to satisfy reserve requirements and balances held in excess of balance requirements. It excludes reserves held in the form of cash in bank vaults, and excludes service-related deposits
Here is the same data except updated on a weekly basis instead of the monthly update as listed above.
Here is what I continue to take away from these data sets. First, Velocity of Money still continues to fall although the data only covers through October of 2013. What might have happened over the last three months since then is unclear but my guess is, with the incredibly frigid winter and massive snow storms, consumer spending would certainly have been impacted. Thus I see no reason for the downward projectory of the Velocity graph to change.
Secondly, and this is the biggie in my mind - note that huge spike in both Excess Reserves and in Total Reserves that has occurred since the beginning of QE in 2008.
There were very few if any who believed that when the Fed first began their grand experiment in QE that it would not adversely impact the Dollar and by consequence positively impact gold, silver and the rest of the commodity complex. Initially it certainly did. However, what we began to notice was that for all this liquidity being created by the Fed, it was not having an inflationary impact as expected. If anything, the only thing seemingly moving higher after the first few years of this QE was the stock market.
Job growth remains abysmal, wages remain stagnant, labor participation rate continues a multi-decade lows, the ratio of total jobs compared to total population is going nowhere, etc,. In short, the economy has stopped worsening, housing sales have picked up somewhat, construction has increased somewhat but as far as strong, rapid growth, forget it. It simply has not happened, even with the enormous sums of money have been conjured out of thin air by the Fed with this Quantitative Easing policy.
Why is that? Well for one reason, based on the above charts, the "money" being created by this bond buying program continues to pile up as excess reserves in the Fed's account. The banks are not lending it into the economy at nearly the same rate that it is being created by the Fed.
Granted, when one looks at those last few charts, it is terrifying to think about what a tsunami that wall of money would unleash in the economy if it were released rapidly into the economy at large in the form of a ramp up in bank lending; however, the fact remains that taking on huge sums of new debt does not seem to be the general order of the day.
If anything, banks are probably more than content to park excess reserves there at the Fed and draw interest on them ( completely risk free) rather than risk lending those sums of monies out and risking some defaults.
The problem in the US economy, in my humble view, is not one of a stingy Fed, it is rather a regulatory and structural environment created by the current administration which continues to stifle business expansion and thus job hiring. One need only look at the runamok EPA and its war on the energy sector, the incredible boondoggle inaptly named the Affordable Care Act ( which is anything BUT that) and the refusal to open more federal lands to oil and gas exploration, a sector which is one of the few creating high-paying and solid jobs.
In short, there is only so much that the Fed can go through monetary policy.
How this impacts gold and the rest of the commodity sector should be considered by those with a bit of a more intermediate term view of things. Given the continued drop in Velocity of MOney and the continued surge in excess reserves, it is unclear to me how inflationary pressures are going to be unleashed into the broader economy as long as those reserves remain parked at the Fed.
Maybe the Fed will next resort of forcing banks to pay it for the "privilege" of holding excess reserves there. In effect, that would amount to a clear effort to force the banks to lend out the money into the economy. Given the increasing lawlessness that marks our nation, and the complete disregards of any Constitutional restraints, who knows what the Fed might do.
I would continue to keep a very close eye on the plight of the US Dollar. If the Fed does anything that might be construed as being negative for the Dollar, gold will move higher. If the Fed however comes out clearly not so much in favor of generating inflation but rather in providing what might be better termed, price stability, then I could easily envision a Dollar that is supported with a corresponding negative impact across the commodity sector in general.
This would not negate the specific supply/demand factors for individual commodity markets but what it would do is remove some incentive for the one-sided, lop-sided "buy everything tangible in sight" mentality that hedge funds are notorious for if they sense a concerted effort to weaken the Dollar.
Saturday, February 15, 2014
Sloping Trendlines
I have been asked this question by some readers and wanted to tackle it here. Many have noticed that I do not often use down-sloping or up-sloping trendlines in my analysis and wonder why.
In the earlier days of my trading career, I relied on them rather heavily. However, the longer I ply my profession it seems to me that their value has decreased considerably. I chalk this up to the changing nature of computerized trading. That is another lesson in and of itself but suffice it to say for now that the vast majority of hedge funds do not "think" when issuing buy or sell orders - they REACT, more specifically, their computers react. This buying or selling comes en masse - there is not the least bit of finesse or skill involved with it. It is more akin to a wall of money slamming into a market and brutally shoving it higher or dropping it lower.
In the past, there tended to be more discretion with trading orders - now we have gone over to the systems trader which means the impact on price tends to get exaggerated at times because nearly all of the computers are reacting to the same thing at the same time. This tends to create imbalances in the demand/supply equilibrium in the market which take some time to sort out.
The result of this is an increase in the number of what myself and other technicians refer to as "false breakouts". A wave of buying or a wave of selling hits a market all at once, picks off a huge number of buy or sell stops and price is severely impacted. However, if the fundamentals do not support the technical price action, eventually - and this is always the tricky part - the balance between supply/demand will resolve or correct itself and the underlying trend takes hold once more.
"What in the world is he talking about?" is probably the question that is now popping up in the reader's mind.
Let me give you an example - here is the Weekly Gold Chart. Notice that I have included a sloping downtrend line. I also ran it right to the edge of the paper for a reason... Based on this chart, gold had been in a downtrend for well over a year when this downtrend line was broken to the upside. I remember this well to be honest but that is a different matter. Immediately the cries came forth - "Look out ABOVE - gold is getting ready to blow". We were going to take out $1900 and soar to $2500 for starters based SOLELY on the fact that this sloping trendline had been broken.
Here is the chart after a few more weeks passed.
As you can see, "whoops" is too mild of a word to describe what happened next. After many proclaimed that merely because a downsloping trendline was broken, gold was resuming its upward march, the market proceeded to plummet from near the breakout point of $1,700 all the way down to $1,200 over the next year's time!
Note something important here which I will talk about farther down in this post - the HORIZONTAL LEVEL of $1,530-$1,525 was violated.
Here is the next downward sloping trendline breach... it occurred in August 2013.
The market had pushed past $1,400 and managed to change its handle, a friendly development. In the process it broke that sloping trendline. Everyone "just knew" that it was back to the moon once more.
OH-OH! It failed to maintain the "14" handle for more than one week and down it went - all the way back down to $1,180 again!
After this week's price action, once again those who dismissed technical analysis when it comes to gold, are pointing out the upside breakout above the down-sloping trendline.
Based on what you have seen above, would you feel completely comfortable with the statement that, "gold has broken out and is about to embark on a major rally"? Personally, I would not.
While these sloping trendlines still should be noted and monitored, I prefer to use HORIZONTAL resistance and support levels as I have come to believe from my own personal experience that they are much more reliable. Even at that we still do get some head fakes from time to time with horizontal levels but they seem to have more predictability when it comes to future price action. If some are inclined to differ about this and want to argue, that is fine just do not expect me to come around to that line of analysis. Getting burned a few times while trading is the best antidote for putting ones fingers into the flame with reckless abandon.
Seriously, if trading was as easy as buying breakouts of sloping trendlines, do you not think that we would have hordes of wildly successful traders infesting the nation?
Please keep in mind that being successful as a trader means employing a wide arsenal of tools. It also means learning to not be too dogmatic to the point of obtuseness. Stay flexible - stay nimble and never get MARRIED to a viewpoint. Divorce is usually a costly affair!
Friday, February 14, 2014
More Dollar Weakness - More Strength in Gold
Dollar weakness continues to be the theme this week as it continues to work lower nearing a chart support level near the 80.00-79.50 zone. If it does breach that support, gold should respond higher. If it holds, look for pressure on gold to emerge in the form of profit taking.
There is no definitive trend yet in the Dollar as it continues to work back and forth in a broader range. The ADX reveals the sideways pattern but the bears are currently in control. Whether the support level will hold and bulls will be able to mount a counter-attack remains unclear at this point. Time will tell.
I have noted the 50 day moving average on the chart but quite frankly, in a market that is trendless, moving averages are generally useless. They are notorious for resulting in whipsaw trades during such times.
I did want to note that the gold shares, as evidenced by the HUI remain very strong and continue to lead the metal higher as they outperform it on the way up. They did the exact same thing as the market was headed lower so the relationship is quite intact.
Note that the index powered through the 200 day moving average which is a big deal in technical analysis circles. Also note that the ADX, on the daily chart, is showing a very strong uptrend in place with the bulls currently in control. The index however is now closing in on what should be considered a pretty good level of resistance on the charts. If it can clear that, 260 is the next test, Expect fierce resistance to surface at this level barring a sharp break in the US Dollar.
Incidentally, I do want to comment on something - while gold was moving lower, we here were noting the breakdown on the technical price charts and noting the bearish posture of the market. I lost count of the number of emails I received from the rabid gold bugs who went out of their way to mock or rail against the entire concept of Technical analysis when it comes to gold. Their view was that since the gold market is obviously manipulated all the time ( their view - not mine ) they stated the utterly uselessness of applying these concepts to the market since the "market was clearly manipulated". Now suddenly, LO! - It's a MIRACLE - we see a plethora of technical analysis "experts" in the same camp noting the bullish chart pattern as they breathlessly drool over the 200 day moving averages, this oscillator, that indicator, etc.
I can be kind and chalk this up to a sudden case of enlightenment but my more cynical nature tells me that this is what is a rampant case of hypocrisy on full display. Apparently technical analysis is only valid when it confirms that gold is moving higher!
I will leave the fair and open-minded reader to draw their own conclusions about this but I already have mine. One of these days I might just put up some of the emails I have received from these rabid dogs to show you just how hateful they can be towards those who dare to speak poorly of their yellow metal god.
As I have said before, I have had some dealings with those trapped in religious cults and I can tell you that the attitude of some of these gold bugs has convinced me even more deeply that in some parts of the honest money camp ( of which I consider myself a member) there is indeed a cultic mentality at work. It is quite scary to be honest. The one thing about being involved in a cult is that it clouds your mind and negates reason and sound judgment. It can be very difficult, if not downright impossible for many trapped in such things to ever come to their senses and realize just how deceived and misled they have become.
I honestly do not harbor any ill will towards them - I actually pity them. They have no earthly idea of how foolish they appear to clear thinking individuals.
I said all that to say this - it is one thing to have strong convictions about a market. It is another thing not to recognize the present reality, or perhaps deliberately close your eyes to the obvious. Any trader that wishes to be successful MUST, MUST, MUST avoid falling into this trap. Stay OBJECTIVE! Do not let your emotions control your reason and your mind. Learn to recognize when you are wrong about a particular market and either get out of its way or at the very least, cut back your exposure to it. This is the only way to survive in a business that has changed so dramatically over the years.
Computer algorithms are heartless automatons which do not care one whit about the size of your hard-earned trading dollars. They will rip it away from you faster than you can spit if you are not careful. The old adage " learn to run away and play another day" should be plastered all over the monitors at your trading desk until you get it!
One last look at the HUI weekly chart to get a better sense of the intermediate picture in the mining sector.
Notice that the ADX line is still moving lower, indicating the absence of a discernible trend at this time frame. The +DMI is now above the -DMI revealing that the bulls have control of the market for now. They have not yet managed to start a strong trend but they have halted the downtrend. I would like to see this index close above the resistance zone noted to be more comfortable with the possibility of a trending move. Such a thing, if it occurs on a weekly closing basis should turn the ADX higher but it will still take a push through the next resistance levels noted on the chart to suggest a powerful uptrend is underway.
Look at the big gap on this chart. If the miners manage to make it that far, they will have to have some sort of powerful tailwind to take them through this gap and up through the 300 level.
Here is a chart of the GSCI again. Note how the commodity sector is moving higher as it approaches a level of chart resistance that it has been unable to clear successfully since early October of last year. If the sector is going to come to life and convince more of the bears to go back into hibernation for a while, the index will need to clear this zone on a weekly basis. If it does, silver should stay firm.
Note by the way how silver is doing what we suggested it would do WHEN COMMODITY PRICES start rising. Silver will not perform well, ( I do not care one whit for all the BS about chronic silver shortages parroted by those who have a vested interest in higher metal prices ) during any such time when DEFLATION is in ascendancy. Silver must have an inflationary environment to propel it higher. The weakness in the US Dollar is therefore even more noteworthy than for gold as currency weakness has tended to attract hot money flows into the commodity sector in general. This is the reason that silver is currently outperforming gold. It will do so as long as the deflation fears are taking a back seat to Dollar weakness.
I will try to get something up a bit later detailing the COT stuff. Speculators are on the long side with commercial interests/swap dealers on the short side once again so all is pretty much back to normal. Short covering among the big specs has been the dominant feature of the silver market. Then again, so has it been among many individual commodity futures markets. Bears are getting pushed out across the entire sector. Gold has finally seen more fresh buying than short covering, an encouraging feature for the bulls as this is a bit more enduring in nature ( as long as chart support levels do not give way). More on that later...
Thursday, February 13, 2014
Old Yeller makes it above $1300
It has been a while since we have seen a "13" handle in front of Ol' Yeller, three months to be precise! Gold has managed to stay firm and avoid any strong bout of profit taking. Dips are being eagerly bought and retracements are very shallow. Shorts are grudgingly now giving up the ghost while some new longs are pushing into the path of least resistance. I get the distinct impression from watching the recent price action that this looks a lot like reluctant short covering on the part of some more enduring bears who are getting out, not in a panic but methodically as the market refuses to break down.
So far the combination of short covering ( dominant feature) and new buying has taken the metal through the $1300 level and right smack dab to the 200 day moving average. If the bulls can gore their way through that, I do not see much chart resistance until near the $13215 region. Beyond that lies $1350 - $1360.
The ADX is very strong and rising in a steady fashion indicating the presence of a good uptrend underway. The break above $1275 seems to have kicked this particular indicator into a bullish posture. Positive Directional Movement is strong. The market still looks overbought to me but momentum is with the bulls and until they see some sort of halt or blockade to further upward progress, there is not much in the way of incentive to force them to book any profits at this point.
Downside support remains near $1275 - $1270.
The drivers for gold appear to be what they have been for a while now - falling longer term rates on Treasuries which are contributing to weakness in the US Dollar. The USDX started off this month near 81.40 and has fallen practically every day this month hitting a low near $80.30 as I type these comments.
As long as the Dollar is struggling, the commodity complex as a whole is getting a bid as we are seeing further signs of our former macro trade in which hedge funds/index funds and assorted large traders are buying tangibles on the heels of Dollar weakness.
Emerging market concerns continue to underpin the gold price as well although Goldman had an excellent note out today that I saw running on the wires about fears of a slowdown in jewelry demand from the far East (Indonesia, Vietnam, etc,) if this credit/currency issue were to intensify.
Thus far gold has been serving as a sort of currency refuge but one wonders how price sensitive or not, gold buying from that corner of the world might be impacted were those regional economies to begin experiencing any economic slowdown coming as a result of all this.
The gold shares had a very nice day today as more and more buyers are showing some interest in the sector now that the gold miners look to have finally gotten the message of the market and gotten their respective houses in order. It took the snot getting beaten out of their stock prices to wake up the rather sloppy management that has been plaguing many of these companies. They now appear to be taking a hard look at the expense side of their books.
Not much more to say about this market for now as time constraints are harassing me and truth be told, there is no fresh economic news at this point. Crude oil remaining above $100 ( WTI), soybean prices soaring and more commodities showing signs of having bottomed out, gold is getting a wind at its back as the Goldman Sachs Commodity Index is closing in on its late December high near 642. If this index shows an upside breakout, rest assured gold will be moving up right along side of the overall sector.
If the index hits that resistance zone and retreats, look for profit taking pressure to show up in gold.
Wednesday, February 12, 2014
Quick Look at GLD
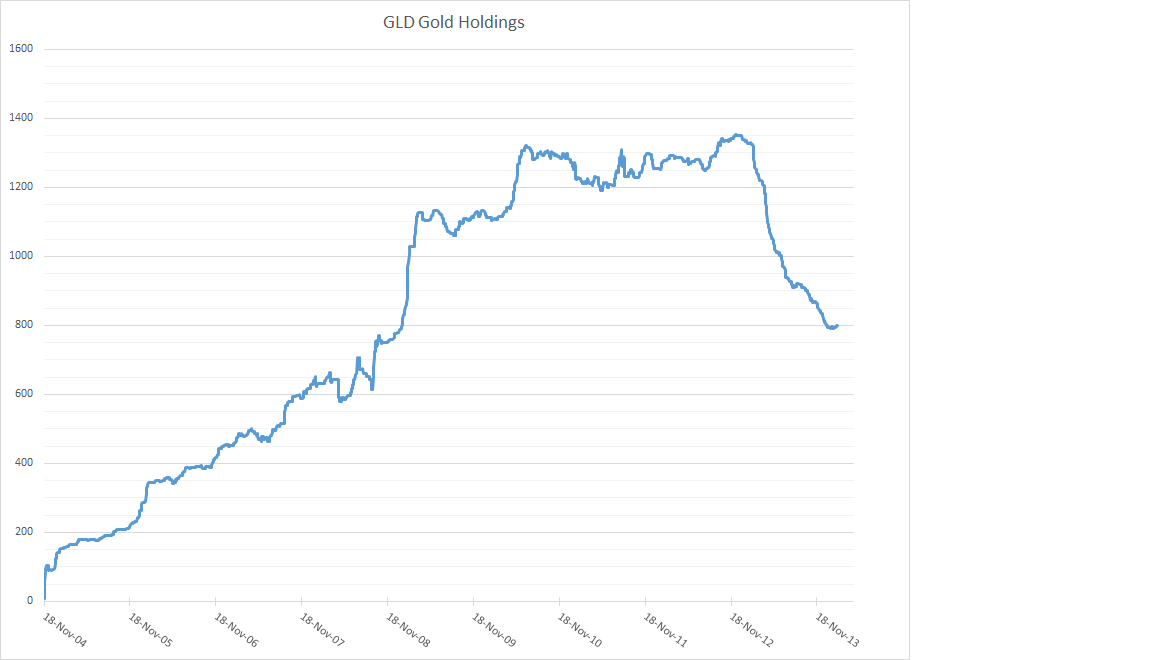
Here is the latest number for the reported holdings of the big gold ETF, GLD. As of the close of business today, GLD is reporting total gold tonnage at 798.85 tons. For a bit of perspective, at the end of last year/start of this year, total holdings were reported at 798.22 tons. In other words, over the last six weeks, Gold holdings in GLD have increased a mere .63 tons!
Yet, the price has gone from 116.17 on December 31, 2013 to 124.43 or an increase of 8.26, some 7%.
What this tells me is that the biggest portion of gains that gold has managed to tack on in this key indicator of Western-based investor gold demand has come from SHORT COVERING, and not from a strong influx of fresh, eager buyers.
No market can sustain any strong advance without a steady, constant steam of fresh buying. Short covering rallies can be quite impressive and can actually flip many technical indicators positive, so they should not be ignored because of the nature of today's computer-based trading programs of the hedge funds.
Also, all true bull markets start with a wave of short covering as the change in sentiment first frightens the bears who have been complacent and riding waves of profits lower as the market descends. Then it attracts some bottom pickers and some opportunistic longs who jump on what they hope is the beginning of a bull freight train leaving the station.
The big question is will this buying become more friendly in the sense that it will consists of more NEW LONGS being put on rather than old shorts being taken off?
Time makes that clear but from a technical standpoint, how the market handles overhead chart resistance levels is key. As more technical levels get violated on the upside, more skeptics commit to the long side. As more skeptics become true believers, sentiment undergoes a shift in which the longs then become complacent and brimming with confidence so that they eagerly buy into each and every dip in price. Let's watch to see what gold will do now that it is nearing a key overhead resistance level, especially in light of the some of the big moves lower in key gold stocks such as Barrick.
Tuesday, February 11, 2014
Gold Shares Continue Strong
Once again another day passes in which the mining shares continue to lead the bullion markets higher. Today the HUI tacked on further gains jumping over 4% in the process compared to a 1.2% gain in the yellow metal.
As long as these shares continue to trek higher, the metals have some additional upside to run.
The key is now what do the shares do now that they have reached a strategic chart resistance level. Notice that they have run to the 200 day moving average. That is a big accomplishment as it has been a long time since the HUI was trading above that particular moving average. To be precise, one has to go all the way back into late 2012 to see this! It would not be unexpected to see this level hold the market for a bit as it takes some time to digest these recent gains. If the bulls keep pushing however, and if the shorts continue to exit, there are two separate overhead resistance zones that the index will try to reach. The first is near 250; the second is near 260. Pushing through both would allow for a test of what should be very, very strong resistance near 280.
I have noted on the Directional Movement Indicators some interesting developments. The upward progress of the index has now taken the +DMI to its best reading since September of 2012. I do not know whether this is a pleasant development in the sense that the index was trading between 520-525 at that time! OUCH is far too mild of a word to note the devastation that has occurred in this sector. Objectively however, that denotes the strength of the recent buying.
The flip side is that the -DMI reading is also at its lowest reading since that same September 2012 period.
One could therefore make the case that the sector is overbought and due for a setback in price. If we did get such, it would not therefore surprise me. The question is whether the bulls will allow for a pause and cash out of some profitable short term trades or if they want to try to push for some more gains before ringing the cash register.
With the ADX rising and just shy of 29, the market is trending higher. That means we should expect to see dip buyers emerge on any setback in price that we might get. The most logical zone to see this occur would be down near the breakout point of 220-222. Support also lies beneath that region near 210. Bulls would not want to see 210 give way as the market would probably fall to 200 to test this important level.
Once again, we had another day in which the US Dollar was weak although that weakness was rather muted. What seems to have been the driver today that goosed both gold and the equities higher in unison was the theme of Janet Yellen's dovishness. The market is convinced that the Fed under her leadership is going to be quite loose when it comes to liquidity issues regardless of the fact that the Fed is on record as hoping to end the QE program completely by the end of the year. Yellen reiterated nothing new or nothing that should come as a surprise when she reaffirmed that the Fed will be heavily dependent on economic data when discussing its retreat from QE. Traders however seem to have the last two most recent jobs reports on their brains and are convinced that the doves are going to dominate the Fed.
I should note however that from my perspective the reason gold continues to move higher is because longer term rates continue moving lower. Take a look at the chart of the yield on the Ten Year Treasury note. You might recall that from the beginning of November last year through the end of December, the price of gold fell from $1350 all the way to below $1200. It was no coincidence that as this was taking place, the yield on the Ten Year ran from near 2.45% all the way to above 3.00%. See the chart below....
As yields have moved lower for the Ten Year, especially due in great part to the fears surrounding the emerging market concerns, gold has responded by moving higher.
If long term interest rates begin perking up again, I expect gold to come under renewed selling pressure once more. The reason for this is because in spite of the great love which the gold bugs have for the yellow metal, the majority of the investment world views gold as just another asset class. Note to gold bugs - please do not condemn the messenger for stating what is obvious but too often overlooked in gold bug circles. What this means is that those who buy it do so not for any yield, dividend or interest payment it might happen to be able to throw off ( it has none) but rather they buy it in the hopes of capital appreciation when they can sell it at a higher price than they paid for it. That requires an environment in which gold is constantly rising higher. (remember the pillars of a bull market in gold).
If gold stalls out in upward movement at the same time that interest rates on the long end of the curve begin to move higher, investors looking to obtain RETURN ON INVESTMENT will jettison gold in favor of another asset class that throws off gain, whether it be by capital appreciation like equities or bonds.
Needless to say it is a given that a higher interest rate environment in the US will make the Dollar more attractive than some of its Western competitors all things considered equal. A stronger Dollar can be expected to put downward pressure on gold prices ( as well as commodity prices in general ) while a weaker dollar provides an incentive for gold to rise ( keep in mind the connection between lower interest rates and a weaker currency).
Interestingly enough, the dynamic of higher interest rates tends to cut into economic growth as it runs at cross purposes to the Fed's QE program which by nature is designed to keep interest rates artificially low to encourage more indebtedness. There does not yet seem to be a consensus as to what level the yield on the Ten Year would have to run to begin negatively impacting overall economic growth but the number that I keep seeing circulating around is the 3.5% level.
Time will make all things clear however.
I will leave you with just a bit of simple advice which I am repeating from yesterday - now that gold is rising higher, resist the urge/temptation/folly to throw caution to the wind and begin swallowing all the usual wild-eyed predictions that will inevitably surface. Stay calm and reasoned and above all - stay a hard-nosed realist.
If gold stops rising, look for factors across the other various markets that are at work instead of the simple-minded "gold is being manipulated" once again chatter. None of these markets trade in a vacuum nowadays but all are interconnected in ways that can be discovered if one takes the time to diligently dig and examine the various reactions that occur regularly through the financial markets. The themes do change and that is what makes trading/investing so challenging at times because we have no way of knowing when those themes will change and if they do, what the new relationship will be. Patient study reveals these things but that requires effort, lots of it.
Subscribe to:
Posts (Atom)