"When misguided public opinion honors what is despicable and despises what is honorable, punishes virtue and rewards vice, encourages what is harmful and discourages what is useful, applauds falsehood and smothers truth under indifference or insult, a nation turns its back on progress and can be restored only by the terrible lessons of catastrophe." … Frederic Bastiat
Evil talks about tolerance only when it’s weak. When it gains the upper hand, its vanity always requires the destruction of the good and the innocent, because the example of good and innocent lives is an ongoing witness against it. So it always has been. So it always will be. And America has no special immunity to becoming an enemy of its own founding beliefs about human freedom, human dignity, the limited power of the state, and the sovereignty of God. – Archbishop Chaput
Trader Dan's Work is NOW AVAILABLE AT WWW.TRADERDAN.NET
One look at the chart says it all:
A fresh 6 + month low was made in the commodity sector earlier this AM.
Some might recall a while back I mentioned that the forward curve in the commodity markets was suggesting LOWER prices ahead, not higher prices, as the backwardation that existed in some of the major futures markets was dissolving with the structure moving more towards the typical contango structure. That was especially true between the old crop ( 2013) / new crop grains spreads.
With the US Dollar attempting to gain some further upside traction and with the commodity indices plunging, as well as the idea that interest rate hikes are coming to the US sooner rather than later, the headwinds against gold are gathering.
Gold bulls had best be thanking their lucky stars for all the geopolitical risk in place right now. Were it not for that, it is unlikely gold would be maintaining itself above key support near $1280.
I noticed that we finally got an updated number for the gold holdings in GLD yesterday. The number had not changed for nearly a week. The new number is a DECREASE of some 1.8 tons. Interestingly enough, the newly reported 800.05 tons is about the same amount that gold holdings have increased since the last business day of 2013 when the ETF reported holdings of 798.22 tons. Another way of saying this is that over the last 7 months, there has been a increase in gold holdings of a paltry 1.8 tons. Clearly Western-oriented investor demand for gold is comatose at the current time. Perhaps that will change as we move forward into Q3 of this year but that remains yet to be seen. With Chinese demand falling off and with Western investment demand on the wane, gold bulls need something to spark this market. It is very sad but that essentially means that they are either going to have to wish for, and even pray for, bad news for someone.
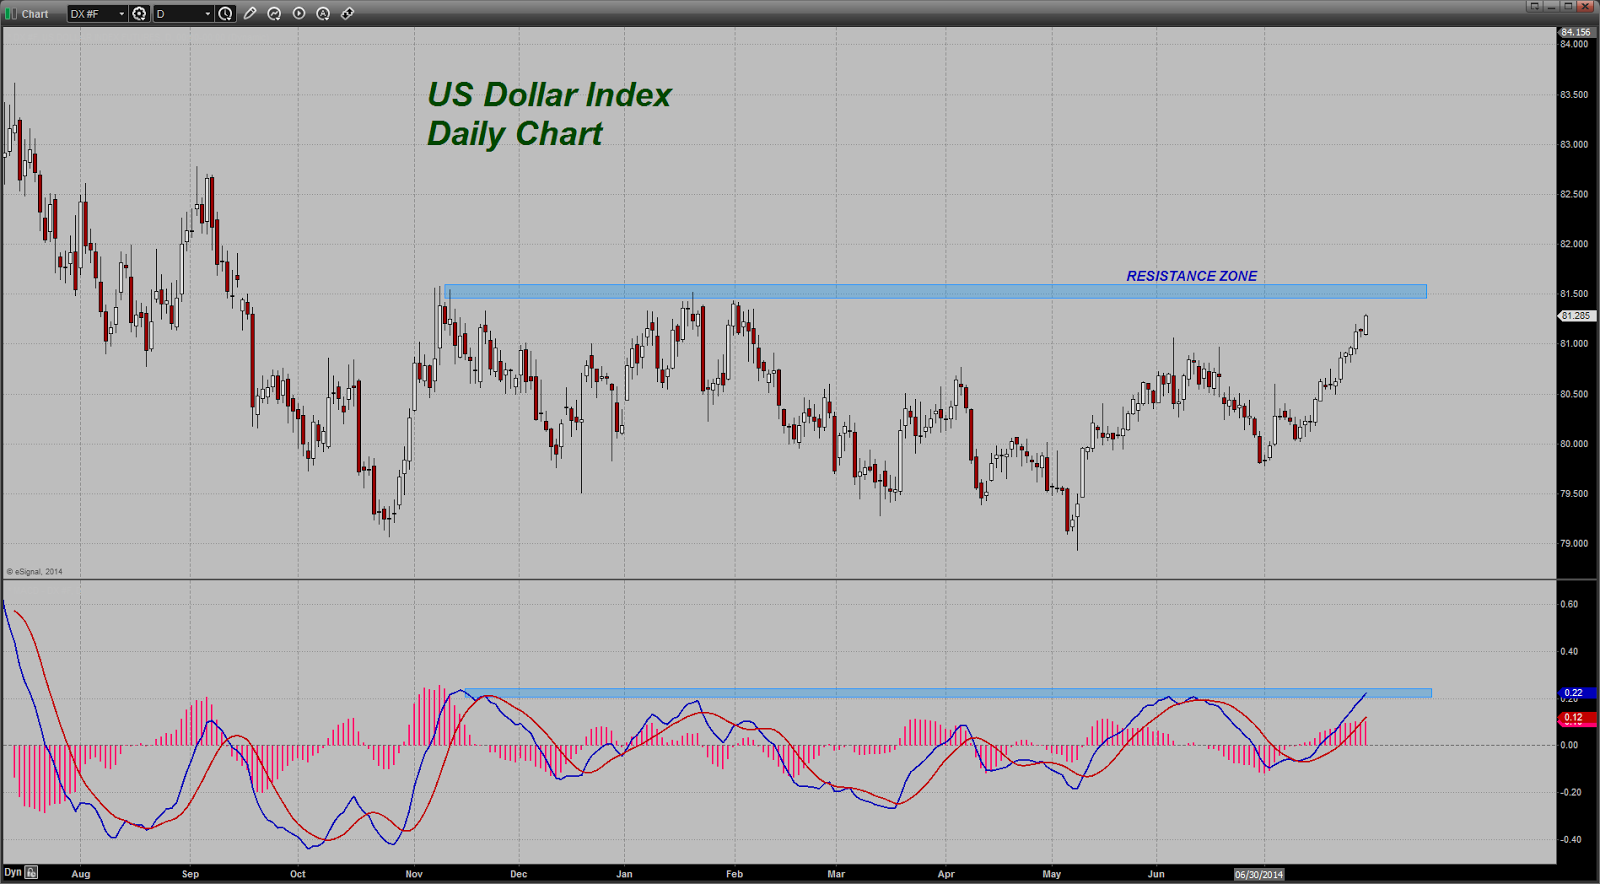
By that, I am referring to the US Dollar, as portrayed by the USDX. The greenback is once again knocking on the door at the top of a nearly year long trading range. That door is up near the 81.65 level. The bottom of the range is near 79.
The week is not over yet but this far the last month has seen the Dollar firm and garnering strength as more and more traders/investors are coming around to the view that the Fed will be the first among the Western industrialized nations to raise interest rates. Today's Service Sector ISM reading did nothing to disabuse them of that notion as it was very strong; stronger than expected in actuality.
Here's the chart...
If the Dollar can manage to finally put up a Weekly CLOSE above that zone noted, it can easily run another full point and should be able to even make a push to 83. We'll see what we get come Friday of this week.
The number sent the Euro reeling. It fell through last week's low and is currently sitting right on support near 1.3370. Failure to hold here should allow a move to the stronger level of support centered near 1.330.
Once again, for the umpteenth time, the usual price predictions from the same culprits ( who never seem to tire of pulling this sort of stunt ) that silver was about ready to experience a massive short squeeze any day now have failed to materialize. I am pleading with any of the readers here at my site who continue to give these charlatans the least bit of credibility to please ignore them and study the price charts for yourself.

Here is a simple fact - they no more know the direction or the timing of the next move in silver, or for that matter any other market, than anyone else on this planet. That they hold themselves out as those who do is cause for embarrassment and for shame but then again, when it comes to puffing up themselves like peacocks , some have no shame. Ignore them and let them go on making fools out of themselves but do not base your investment strategy around the claims of such people. They CANNOT BE UNBIASED because their livelihood depends on creating demand for their products or services. Remember that.
The charts are your friends. You may not like them or may not agree with the charts, but fighting them is a hopelessly quixotic errand that will cost you very, very dearly. I have been at this business for over a quarter of a century and while there are some markets that I know very well and trade daily, I still do not have the temerity to suggest that I know exactly when they are going to make a move or to what extent. If I did, Bill Gates would have a rival for one of the world's richest men.
The best of us are still mere mortals. Some have more experience than others and are perhaps a bit wiser but we are not omniscient. There is only ONE who is.
As said many times here before, the grace of humility is much more befitting of a successful trader than arrogance and unbounded hubris.
If you want to see what the obstacles are to gold embarking on a new, sustained, sharp upward trending move, take a look at the following set of charts.
The first is one drawn from the Commitment of Traders reports. It denotes the TOTAL OPEN INTEREST. I use this to get a sense of money flows either into or out of, a commodity.
The dark line is the total open interest. Can you see what it has been doing since the peak in the gold price back in 2011? It peaked well over a million contracts of futures, plus options. This week it had nearly fallen to nearly one half of that record level!
What does this tell you? Answer - "interest" in gold as an asset class among Western-based investors has plunged over the last three years.
What has been the result? Answer - the gold price has also plunged.
Inference - speculative demand drives gold prices. If that demand falls, so too does the gold price. If that demand rises, so too does the gold price. There is nothing sinister about any of this as those constantly crying up "manipulation" would have you to believe . It is a function of demand or the lack thereof.
Here is the next chart to consider. It is the reported holdings of the large gold ETF, GLD.
The amount of reported gold holdings in the trust at the end of last year was 798.22 tons. The yet to be updated amount reported as of this Friday's close was 801.84 tons. That amounts to a rather lackluster increase of a mere 3.62 tons in eight month's time. Hardly the stuff of legends now is it?
The point in this is to illustrate SENTIMENT. Frankly as a trader I try not to get too bogged down in intricate details when looking at things like this. I want to try to glean whether or not an asset class is in favor among the big speculators that dominate our markets. If it is, I want to be with them. Trying to fade them and play the "contrarian" is a surefire method to lose money. One has no idea when they are going to shift. You can observe their buying or selling and try to anticipate what they are going to do, but until you get a clear signal, do not act, unless of course you enjoy donating your wealth to them on a regular basis.
There seems to be a mindset among some reckless individuals that a successful trader is "brave, daring to go against the masses and take the other side of a popular trade". They seem determined to prove to themselves how noble they are or some other such nonsense by so doing.
You see it all the time... "prices have fallen so much that it is time to buy". It is said that " a fool and his money are soon parted". That is never so true as in the trading arena, and particularly in the commodity futures world. How do you know that the price cannot fall further? Or how to you know that the price cannot rally higher if you are shorting a market? Answer - you don't. Now of course you can roll the dice and gamble that you are correct but trading is not gambling. I would suggest that if you want to gamble that you exit the trading profession and become a full time player in Vegas. If you are going to lose your money, you might as well do it surrounded by beautiful women and good food and music! It sure beats giving it to some nameless hedge fund manager and his pet computer.
Switching gears here - I mentioned that I wanted to see this week's COT reports for corn to determine whether or not the big speculators were still on the net long ( AND WRONG) side of the corn market or whether they might have finally made the transition to the short side. Guess what? They are still long and wrong! I continue to find this nothing short of astonishing. I have seen a lot of bull and bears markets in the commodity sector in my time but I cannot remember very many of them in which the largest specs had missed out and were on the wrong side of a major trend.
This corn market therefore astonishes me.
Take a look at the chart...
Now look at the positioning of both the hedge funds and the other large reportables. Both of them are still net long
You will observe that the hedge fund net long position peaked in April of this year when corn stalled out near $5.20. Since then it has fallen nearly $1.70/ bushel.
The hedgies began building their net long position back in November of last year when corn prices were in the general vicinity of $4.20. Prices have fallen another $0.70 since then meaning those hedge funds who bought in last November and who are still long are seriously underwater on their trades. One would have thought that once that entry level was violated on the charts, their computers would have taken them out. Apparently not so.
Not to be outdone, the other large reportables have been net long corn since the days of Noah. They too are getting their butts handed to them. The little guys however, the small speculators, the ones that are constantly being mocked by the big specs as being the "dumb money" have been taking the large specs money from them as they have been short this market for a long time.
Obviously I am speaking in generalities in the sense of "categories" since not all hedge funds are losing money ( some are indeed short as are some of the other large reportables) but the point is being made that sometimes even the large specs screw up royally in a trade.
My question at this point is whether or not the big speculators are ever going to actually move to the net short side of this market. They did so in the soybeans but have not yet done so in the corn. If they do, and I have no way of knowing whether or not they will, there is a fair amount of further downside in the corn market. Maybe they will essentially move to being flat and that will do it for their selling but even if they do that, we could easily see corn drop another $0.20/bushel from current levels, if not more.
I would think that end users would look at prices at that level as being so cheap compared to recent years that they would trip over themselves to get long side coverage. Ditto goes for the export buyers but I have learned that low prices can always go even lower. We will just have to watch the price action and see what the market is telling us.
Still, this is one of those charts and years that I am planning on not forgetting. A huge bear market in which the largest speculators have missed the move lower and were on the wrong side with the small speculator reaping the reward.
The Goldman Sachs Commodity Index is currently down 2.4% on the year. Grain and energy prices are continuing their descent. Meat prices are following. As written many times here over the past couple of months, meat prices will be coming down by the time we reach the 4th quarter. They are already breaking down at the wholesale level.
Seriously, I would like any OBJECTIVE reader to take one look at this chart and then tell me, with a straight face, that inflationary pressures are on the rise as it relates to the cost of tangibles.
If that is not enough, here is a chart of the Unleaded Gasoline.
It has retraced exactly 61.8% of the price move made since late November of this year to the peak near $3.15. You'll notice that it managed to spend about a week consolidating at the half-way or 50% retracement level before it puked lower. If it does not hold here, it should see a further leg lower towards $2.66.
As a consumer at the gasoline pump, I am delighted to see this chart. It means I have more disposable income with which to buy ridiculously high-priced beef for throwing on my pit smoker the rest of this summer. I am however looking for some good bar-b-q methods for caviar since there seems to be little difference in price between fancy fish eggs and brisket.
Quite frankly, if gold is going to get some help for its upside, it had best not be looking at its fellow commodity markets as they are acting as a weight on it. Gold must function as a monetary metal at this point if it is to trek higher and that means it is going to require geopolitical events or currency distress somewhere to get speculators in a mood to chase it. Today's decent but lower than expected payrolls number, took some of the sense of urgency out of this week's talk that the Fed was going to move on the interest rate front sooner rather than later. That was shelved by the jobs number today and in conjunction with the breaking of the ridiculous cease-fire in Gaza, along with some further tensions tied to Ukraine, there were some safe haven flows back into gold, and into bonds, I might add, in today's session.
The Dollar ran into some selling today when the payrolls number came out for the reasons listed above. The weaker than expected reading took some of the "hike in interest rates" premium out of the greenback. It especially allowed the safe haven bid that showed up today to be seen in the Japanese Yen which once again refuses to move in the same direction for any time frame longer than a couple of weeks.
Equities are currently weaker as I type these comments but are off their worst levels of the session. The Russell 2000 is moving back down to the bottom of its recent range trade between 1210 on the top and 1100-1090 on the bottom. The RSI is at a level commensurate with previous recoveries in price. Only if this index does not bounce off of the bottom of the range can we say that a more substantial break in price is underway. Some are already talking bear market but the index would need to fall below 1090-1080 to have experienced a drop of more than 10% off its best level and provide confirmation for that sort of talk. In other words, it is premature to say that a significant correction is underway. Further price and chart action is required for confirmation. Until then, the odds favor a continuation of the existing trend or price action and that has been either higher or range bound.
There are still plenty of equity bulls around who want to buy dips at this point. Price action will have to prove them wrong. So far, they have been right.
I will go over some of the COT stuff later on today. I am especially interested in seeing whether or not the hedge funds are still net long in the corn market, even after the $1.70 decline since May. I find the fact that they were still on the net long side of this market last Friday almost too much to believe. Talk about blowing a call on market direction!
Wheat prices have steadied as harvest pressures subside somewhat with KC wheat leading Chicago. Beans are seeing more pressure as the benign weather and forecasts calling for more of the same, continues. The market is still being supported only by tight old crop supplies but once harvest kicks in and moves north, basis levels are going to fall apart in my view.
More later....
Not only are equities being pummeled this morning, the commodity sector is also seeing heavy selling pressure. There are some individual markets within the sector that are managing to shrug off some of the selling pressure, ( coffee for instance - that doesn't count anyway since that market was set up by aliens to trap earthlings prior to whisking them away into outer space) but overall, the entire sector is dropping sharply lower.
The GSCI just notched a brand new 5 month low this morning, especially with the energy sector dropping as it has. Even the high flying cattle market has been unable thus far to resist the selling.
Once again, the safe havens are back on as the US Dollar and the Japanese Yen are higher with bonds pulling into plus territory after collapsing a full point earlier in the session.
End of month book squaring is further muddying the waters today.
The low reading for initial unemployment claims has spooked gold bulls who are worried that the upcoming payrolls numbers are going to come in stronger than expected. The thinking is that the Fed's hand is going to be forced to raise interest rates sooner rather than later. That remains to be seen but with the sharp drop in equities, that sort of talk is a bit premature. It does however underscore just how sensitive the gold market is to any talk of higher interest rates. Higher rates will act as a headwind to gold, which throws off no yield.
The US Dollar has not yet been able to convincingly push past 81.60 basis the USDX. If it does, look for more selling across the gold market especially with commodity prices heading lower, especially crude oil and its products.
It is going to be interesting to see whether or not the equities experience one of those famous last hour recoveries today.
Gold has fallen back below the 45 day moving average and looks to be setting up a test of the support zone noted on the chart near the $1280 level.
Crude oil lost its chart support this morning but thus far has managed to find a floor above the $98/barrel level. There looks to be some better defined support near 97.60 - 97.50. the ADX is rising but does not yet indicate a trending move. That suggests the market will find some support sooner rather than later. If the secondary support level does give way however, crude could retrace towards 96. That would put it at the lowest level since early February.
Today's stronger than expected Q2 GDP number ( 4% compared to expectations of 3%) has ramped up selling in the longer dated section of the curve. The long bond is down over a full point as I type these comments. The Dollar is also benefitting, particularly against the Yen today, as forex traders are buying it and selling the rest of the majors. Talk has now shifted ( at least for today) firmly in favor of higher interest rates coming to the US before any of the other industrialized nations.
Take a look at the daily chart of the US Dollar ( USDX). Note that the greenback has run right into the zone of heavy chart resistance pictured on the chart. That resistance zone is a function of a downside gap made all the way back in September of last year. The gap has served to cap the Dollar's upward movement for nearly a year. Seeing it challenged today is therefore something that should not be ignored. If the Dollar can punch through this level on a closing basis today, and then repeat it tomorrow, we should see some additional buying come in.
The ADX is showing a decidedly bullish chart picture with the bulls firmly in control of the market. The indicator itself is above 30 and rising - evidence of a strong bullish trend. If that resistance zone does give way as noted above, this thing could turn into something stronger on the intermediate term charts. Above 81.60 there is resistance at 82 and again near 82.50.
Here is the chart of the long bond. It seems to have reached its zenith near the 139 level. Today's GDP number was simply too much for the market to extend any higher. We have a ceiling now at this level for the time being meaning it will take some sort of safe haven event to kick the ceiling down or some very bad economic news from somewhere. The indicator is turning down and getting ready to confirm the negative divergence that was created recently. We'll have to see whether the bonds are setting up a range trade or whether this is the start of a longer lasting downtrend. It is far too early to assert the latter with any dogmatism.
Copper is benefitting from the stronger GDP number.
Hog prices continue to reel from traders reassessing the overall impact from the dreaded PED virus. Record heavy weights are offsetting most, if not all, of the impact of the disease on the slaughter numbers. I mentioned repeatedly over the last few weeks for hog producers to get some hedge protection on expected Q4 and Q1 2015 production while record prices were being seen. I hope some of you hog producers out there took that to heart. I have similar concerns about the cattle at this point. Cattle producers are basking in record profits right now but these things do not last forever. Do not be penny wise and pound foolish. Get some hedges in place on expected future production while you can. Do not wait until you HAVE TO get the protection. Speculators - I am speaking to producers right now.
Bean prices are giving up the gains from their recent rally that was due to heat and dryness talk. Bulls talk that up every season so that is not new. The forecasts however are showing some rain entering the mid-West next week and with no searing hot temperatures anywhere in there, growing conditions remain very good for the majority of the crop. Yes, there are some areas where the crop deteriorated slightly ( I noted that on my Monday take on the USDA Crop Conditions ratings) but those small pockets cannot detract from the fact that the majority of the crop is still in very good shape.
Look at what continues to happen in the overall commodity sector...
It is showing a loss on the year at this point. Simply put, those investing in commodities as an asset class this year, particularly those looking for inflationary pressures to show up, have been on the wrong side of the complex. Now of course that could change but the fact is that while overall economic growth globally has been okay, it has not been strong enough to power the sector higher. Demand is not there as it once was. We'll have to see if growth can pick up from current levels.
A stronger Dollar threatening to move into a sharper uptrend and falling commodity prices do not augur well for higher gold prices. As stated here yesterday, it is geopolitical events that are keeping gold above the $1280 level right now.
Since November of last year, the US Dollar has been thwarted from beginning any sort of upward trending move by the region near 81.50 on the USDX. It is once again moving towards a showdown with this critical chart region. Can the Greenback blast through and start a stronger trending move or will it merely bounce off and move lower once more? Stay tuned.
Seeing that the Euro comprises over half of the USDX, we are keeping a close eye on the currency. Ever since Draghi began his campaign of talking it down when it was near 1.40, the Euro has struggled to maintain any sort of bullish momentum for long. The reason has to do with interest rates - traders are convinced that the next move by the Fed in raising rates will be well ahead of any move by the ECB to raise rates in the Eurozone. Simply put, while the Fed is talking about curbing monetary liquidity measures over here in the US, the conversation in the Euro zone has been whether to become more aggressive over monetary liquidity measures over there. Such sentiment favors the Dollar over the Euro.
The currency is approaching a psychological round number support zone near 1.340. Failing to hold here would set it up for a further drop down towards 1.330.
The ADX is above the key 30 level and is continuing to rise indicating the presence of a strong trending move lower at this time.
One has to wonder if gold would be able to hold $1280 should the Euro fall accelerate. In my view the only thing currently holding gold higher is geopolitical tension. Were it not for those events ( and who knows how all this is going to end) gold would be lower, especially with the Dollar strength we are witnessing. Those events should continue to bring some safe haven buying into the yellow metal for the time being which will work to mitigate any sharp drops in price that could occur.
Meanwhile, the commodity sector ( overall ) continues to display weakness. Falling crude oil prices ( it has been unable to break out above former resistance near $105), falling grain prices ( for today), and weakness in some of the softs and hogs, are pulling it lower. Silver is bucking the lower trend in commodities today for some reason. Frankly, I do not know why nor do I care. That metal tends to live it in its own little world. There might be some copper/silver spreads being unwound which is benefitting it today at the expense of copper.
This afternoon's USDA Crop ratings showed a slight bit of deterioration in the crops this week. Coming from the incredible conditions that they have held for much of this growing season, it is not unexpected to see some slight degrading of the crop at this point. None of it is serious however.
Corn rated in the Good/Excellent category fell 1% to 75% from last week's 76% - hardly a devastating decline. The rating decline came not from the Excellent category which remains the same as the previous week at 22% but from the Good category which gave up 1% falling to 53% from last week's 54%. The Fair category remained the same at 19% while the Poor category rose that same 1% to 5% from 4% the previous week.
My viewing of the report shows that the big three ( the "I's" as I prefer to call them - Iowa, Illinois and Indiana ) actually improved this past week or remained the same. Iowa index increased to 109 from 108; Illinois increased to 112 from 111 while Indiana remained the same at 108. Minnesota actually improved as well to 103 from 102. Nebraska dropped a point to 107 from 108.
The slight overall deterioration in the total index seemed to come from Kansas which fell to 100 from 103 and from Wisconsin which fell to 106 from 108. For the purpose of repetition, a rating of "100" is normal. As you can see, most of the big producing states still have some outstanding corn crops at this point.
As far as crop progress goes, 78% of the corn crop is in the silking stage compared to 67% last year and the 5-year average of 75%. 17% of the crop is in the dough stage compared to a mere 8% at this time last year and the 5-year average of 16%.
Switching to soybeans, 71% of the crop is rating Good/Excellent compared to 73% last week. In the big three, the Illinois crop improved to 109 from 108; Indiana lost a point to 105 from 106 and Iowa remained the same at 107. Minnesota and Wisconsin remained the same as the previous week.
As with corn, Kansas saw some deterioration of the crop falling to 102 from last week's 104 reading. Nebraska and North Dakota each lost a point to 105 and 107 respectively.
As far as crop progress goes, 76% of the crop is blooming versus 62% last year and the 5-year average of 72%. 38% of the crop is setting pods compared to only 18% last year and the 5-year average of 31%. As you can clearly see, the bean crop remains well ahead of schedule, something which is a positive given the recent talk of drier weather ahead.
I am not sure how much of this is already in the market after today's 20+ cent gains in the beans. Weather forecasts at this stage will have much more of an impact on the bean market than the corn market although the trade will still prefer to see some timely rains. From what I can see of the longer range forecasts, I do not see any intense heat at this point. It does look dry for the next week but without any severe heat. That will allow for corn to finish up pollination without any undue stress at this juncture.


