here are the numbers we are currently working with compliments of the USDA:
In million metric tons.
--change--
--2014/2015- --2013/2014-- Nov 14/15 Nov 14/15
Nov Oct Nov Oct Oct 14/15 Nov 13/14
World 312.06 311.20 285.01 285.01 0.86 27.05
United States 107.73 106.87 91.39 91.39 0.86 16.34
Total Foreign 204.33 204.33 193.62 193.62 0.00 10.71
South America
Brazil 94.00 94.00 86.70 86.70 0.00 7.30
Argentina 55.00 55.00 54.00 54.00 0.00 1.00
Paraguay 8.20 8.20 8.10 8.10 0.00 0.10
Bolivia 2.50 2.50 2.40 2.40 0.00 0.10
Uruguay 3.40 3.40 3.50 3.50 0.00 -0.10
East Asia
China 11.80 11.80 12.20 12.20 0.00 -0.40
Korea South 0.13 0.13 0.15 0.15 0.00 -0.02
Korea North 0.17 0.17 0.16 0.16 0.00 0.01
Japan 0.21 0.21 0.20 0.20 0.00 0.01
The thing that really stands out to me is the size of the increase of global supply for the 2014-2015 marketing year compared to last year. What is even more interesting is that Brazil had a huge crop last year and this year the USDA is projecting it to be even larger. Barring any sort of serious weather related issues down there for their growing season, there is not going to be any shortage of beans anytime soon.
None of this however has seemed to faze the hedge funds which have been buying beans like they are going out of style of late. It is also apparently, at least for the immediate moment, lost on China, which has been sucking up beans from here in the US like an oversized vacuum cleaner.
We'll now see with these numbers, if the cancellations from China begin in earnest or whether they will play some more with the US markets.
Monday, November 10, 2014

Has Meal Topped Out?
That has been the question on the minds of grain traders for some time now as it has been strength in the meal which has dragged the entirety of the grain floor higher. Funds are big, big longs in the meal and as also net long in the beans and in the corn based on last Friday's COT reports.
Today's USDA report generated a negative reaction in the beans, and especially in the meal, when the dust finally settled at the close of pit session trading. The report showed a slight increase in yield but that was fully priced into the market.
Essentially, the way I am reading the reaction to this report, is that it did not contain enough of a bullish surprise to justify beans levitating up at current levels. After all, we have seen them put on more than $1.50/bushel over the last few weeks. With a run like that, it would have taken a strong bullish surprise to generate much in the way of determined buying up at these levels. The beans did not get that in the report and it looks as if their inability to extend the bump higher after the first few seconds of the report, started some profit taking from some of those heavy speculative longs.
I do not want to count them out too soon however as those who have been buying them are looking more at demand issues rather than supply issues. they have been able to use a recent torrid export pace by China, coupled with logistical issues in the eastern portion of the belt, to obliterate a great deal of the shorts, not to mention pushing even harder on their profitable longs.
However, in watching the chart performance of the January meal, we may have, and I am not convinced just yet, seen a top in this complex. The meal led it up and the meal will lead it down, if indeed it is going to do so.
I am not focusing so much on the December meal because that particular month might still be impacted by the transportation bottlenecks and has seen some very wild buying and selling as it swings back and forth. However, most in the trade expect whatever remains of those issues to be cleared up sometime before the end of the year, and maybe by the end of this month. Thus we are looking past the December meal and focusing on the January meal.
That month missed a textbook outside reversal day lower by 10 cents today. The strict definition of such an occurrence is when a market that has been in an uptrend, makes a new high, exceeding that of the previous day, and then proceeds to move steadily lower throughout the session scoring a low EXCEEDING the previous day's low. Ideally it also CLOSES below that same previous day's low.
Look at the chart and you can see that the January meal exceeded the high from Friday, then moved lower throughout the session, taking out Friday's low in the process and then closing at $364.70 compared to Friday's low of $364.6.

So it did not quite make that close below the previous day's low. Yet the range it established was well outside of Friday and it occurred on extremely heavy volume.
I am also noting that the market ran up to the near the 75% Fibonacci retracement level where it failed. Also, today's high failed to reach the $384 level essentially establishing the potential for a double top with a weak right side.
All this gooblygook might not mean anything much to some but for those of us who study the charts, it does look like a serious chink in the armor of the meal bulls has been inflicted. Yet, as treacherous as this market has been of late, I am not getting too dogmatic about it just yet.
We'll have to watch subsequent price action and see what we get and then perhaps we can get some confirmation, one way or the other.
A quick note on gold.... the violent short covering rally of Friday reversed rather quickly today as soaring equities and sinking commodities, along with a resurgence in the Dollar, brought a large amount of selling back into the metal. Mining shares gave back nearly every single bit of the gains made that day as well.
We'll probably range for a while unless we get a stronger signal from another outside market to work with. Bears will try to take it back down to $1130, while bulls must get the price above $1180 to have a shot at doing something more than a one day wonder.
Today's USDA report generated a negative reaction in the beans, and especially in the meal, when the dust finally settled at the close of pit session trading. The report showed a slight increase in yield but that was fully priced into the market.
Essentially, the way I am reading the reaction to this report, is that it did not contain enough of a bullish surprise to justify beans levitating up at current levels. After all, we have seen them put on more than $1.50/bushel over the last few weeks. With a run like that, it would have taken a strong bullish surprise to generate much in the way of determined buying up at these levels. The beans did not get that in the report and it looks as if their inability to extend the bump higher after the first few seconds of the report, started some profit taking from some of those heavy speculative longs.
I do not want to count them out too soon however as those who have been buying them are looking more at demand issues rather than supply issues. they have been able to use a recent torrid export pace by China, coupled with logistical issues in the eastern portion of the belt, to obliterate a great deal of the shorts, not to mention pushing even harder on their profitable longs.
However, in watching the chart performance of the January meal, we may have, and I am not convinced just yet, seen a top in this complex. The meal led it up and the meal will lead it down, if indeed it is going to do so.
I am not focusing so much on the December meal because that particular month might still be impacted by the transportation bottlenecks and has seen some very wild buying and selling as it swings back and forth. However, most in the trade expect whatever remains of those issues to be cleared up sometime before the end of the year, and maybe by the end of this month. Thus we are looking past the December meal and focusing on the January meal.
That month missed a textbook outside reversal day lower by 10 cents today. The strict definition of such an occurrence is when a market that has been in an uptrend, makes a new high, exceeding that of the previous day, and then proceeds to move steadily lower throughout the session scoring a low EXCEEDING the previous day's low. Ideally it also CLOSES below that same previous day's low.
Look at the chart and you can see that the January meal exceeded the high from Friday, then moved lower throughout the session, taking out Friday's low in the process and then closing at $364.70 compared to Friday's low of $364.6.
So it did not quite make that close below the previous day's low. Yet the range it established was well outside of Friday and it occurred on extremely heavy volume.
I am also noting that the market ran up to the near the 75% Fibonacci retracement level where it failed. Also, today's high failed to reach the $384 level essentially establishing the potential for a double top with a weak right side.
All this gooblygook might not mean anything much to some but for those of us who study the charts, it does look like a serious chink in the armor of the meal bulls has been inflicted. Yet, as treacherous as this market has been of late, I am not getting too dogmatic about it just yet.
We'll have to watch subsequent price action and see what we get and then perhaps we can get some confirmation, one way or the other.
A quick note on gold.... the violent short covering rally of Friday reversed rather quickly today as soaring equities and sinking commodities, along with a resurgence in the Dollar, brought a large amount of selling back into the metal. Mining shares gave back nearly every single bit of the gains made that day as well.
We'll probably range for a while unless we get a stronger signal from another outside market to work with. Bears will try to take it back down to $1130, while bulls must get the price above $1180 to have a shot at doing something more than a one day wonder.
USDA Supply/Demand Report Day
The much anticipated USDA report hit the wires this AM and as usual, has touched off an enormous flurry of algorithmic activity.
As far as the soybean market goes, pre-report expectations were very accurate this time around. Most analysts expected a slight bump higher in the yield per acre number which would boost the final crop size somewhat but keep it below the 4 billion bushel number.
The total production number, on a yield of 47.5 bushels, is expected to be 3.958 billion bushels. That is slightly higher than last month's number of 3.927 billion.
USDA bumped up the crush 10 million bushels and exports by 20 million bushels, in response no doubt to the torrid export pace that we have seen thus far.
They thus managed to find another enough demand to offset the pop in supply leaving the expected carryover at 450 millions bushels, exactly unchanged from last month's number.
It is however, 5X larger than the ending stocks of the 2013-2014 marketing year which USDA left unchanged at 92 million bushels.
The corn is what took many by surprise as USDA lowered the yield from 174.2 bushels to 173.4. That took the total production down slightly to what is still a record 14.407 billion bushels from the previous month's 14.475 bushels. That is a drop of 68 million bushels.
They did kick corn used for ethanol up 25 million bushels as ethanol producers have been having a field day with this cheap corn.
Ending stocks thus were reduced down to 2.008 billion bushels compared to last month's 2.081 billion bushels. Last year's marketing year carryover was 1.236 billion to give you some perspective. Thus we are a bit shy of having twice the corn left over this marketing year than we had last year.
Corn bulls are getting all giddy over the number but it is difficult for me to get too excited about a record corn crop and a carryover of this size, especially given the very weak export numbers we have been getting of late. Maybe end users will decide to buy now based off of this report but that remains unclear.
The question will be what are farmers going to do now that the market has rallied some 60 cents ahead of this report and are slightly higher now after the report? Unless we get a demand surge from somewhere, we are certainly not going to be running out of corn anytime soon.
Early price action in response to the report is some weakness in the beans, notably in the meal, and some strength in the corn. I am unsure what percentage of this is spread unwinding. There are HUGE numbers of spreads that are being lifted or implemented right now and that activity if causing some fairly widespread volatility.
We will have to see how the dust settles today after some of the big commercial firms have had some time to go through the numbers and digest them. Right now it is all machine driven action.
As far as the soybean market goes, pre-report expectations were very accurate this time around. Most analysts expected a slight bump higher in the yield per acre number which would boost the final crop size somewhat but keep it below the 4 billion bushel number.
The total production number, on a yield of 47.5 bushels, is expected to be 3.958 billion bushels. That is slightly higher than last month's number of 3.927 billion.
USDA bumped up the crush 10 million bushels and exports by 20 million bushels, in response no doubt to the torrid export pace that we have seen thus far.
They thus managed to find another enough demand to offset the pop in supply leaving the expected carryover at 450 millions bushels, exactly unchanged from last month's number.
It is however, 5X larger than the ending stocks of the 2013-2014 marketing year which USDA left unchanged at 92 million bushels.
The corn is what took many by surprise as USDA lowered the yield from 174.2 bushels to 173.4. That took the total production down slightly to what is still a record 14.407 billion bushels from the previous month's 14.475 bushels. That is a drop of 68 million bushels.
They did kick corn used for ethanol up 25 million bushels as ethanol producers have been having a field day with this cheap corn.
Ending stocks thus were reduced down to 2.008 billion bushels compared to last month's 2.081 billion bushels. Last year's marketing year carryover was 1.236 billion to give you some perspective. Thus we are a bit shy of having twice the corn left over this marketing year than we had last year.
Corn bulls are getting all giddy over the number but it is difficult for me to get too excited about a record corn crop and a carryover of this size, especially given the very weak export numbers we have been getting of late. Maybe end users will decide to buy now based off of this report but that remains unclear.
The question will be what are farmers going to do now that the market has rallied some 60 cents ahead of this report and are slightly higher now after the report? Unless we get a demand surge from somewhere, we are certainly not going to be running out of corn anytime soon.
Early price action in response to the report is some weakness in the beans, notably in the meal, and some strength in the corn. I am unsure what percentage of this is spread unwinding. There are HUGE numbers of spreads that are being lifted or implemented right now and that activity if causing some fairly widespread volatility.
We will have to see how the dust settles today after some of the big commercial firms have had some time to go through the numbers and digest them. Right now it is all machine driven action.
Sunday, November 9, 2014
Another Eureka Moment for the Gold Bugs
The internet is breathlessly ablaze over a story detailing UBS and its plan to settle allegations over details concerning its precious metals trading. It seems like Christmas has come early in the world of gold conspiracy world.
Yet, this has an eerie quality about it once more. Why do I say that? Simple - because the entire claim of the Gold is Always Manipulated All The Time crowd ( GIAMATT) is exactly as articulated in the Paul Craig Roberts's article which I refuted in a previous post earlier in the day today. And what is that?
In his own words. Mr. Roberts claims that the big banks ( whom he refers to as 'agents of the Fed' ) are guilty of illegal activity to suppress the price of gold and discredit it. They do this by selling unlimited amounts of paper gold contracts at the Comex ( the scene of the crime according to him and those who view his pronouncements as gospel). The reason they do this is very clearly laid out -
“Eric, it’s clear, this is the Federal Reserve protecting the value of the dollar from quantitative easing and the massive increase in the supply of dollars and dollar-denominated debt.
This is exactly the theme that the gold price suppression scheme advocates have been claiming for years now. Those of you who remember my writings from the earlier days when gold was actually in a bull market, know that I was once a proponent of this theory. At the time, the US Dollar was sinking into oblivion and was threatening a major collapse on the price charts. Gold is the Anti-Dollar so it made perfect sense to me to give support to this view. After all, the feds have stepped into the foreign exchange markets from time to time to address currency valuations as well as form a Treasury Exchange Stabilization Fund known more commonly as the Plunge Protection Team.
However, I parted ways with some of the my former 'friends' over this when the fundamentals behind gold's move higher began to deteriorate and the bull market ended and a new bear market began. There was no longer any reason whatsoever for the feds to try to suppress the rise in the price of gold ( something which they failed to do by the way when the price hit $1900 before finally topping out for good).
Here is a series of questions that none of the gold price suppression scheme advocates will deal with honestly? Why is the Dollar no longer falling against nearly every single currency in the world? Why is the price of nearly every single commodity falling? Why is the TIPs Spread falling? Why is the Velocity of Money falling? Why are the Central Banks desperately trying to fight off Deflationary pressures and longing for their target of 2% inflation and failing to meet it? Why can anyone expect gold to be moving higher in a deflationary environment in which the price of most commodities, especially energy prices, continue to fall?
Keep in mind that none other than Jim Sinclair had written quite elegantly many years earlier about what he correctly termed the FIVE PILLARS of a BULL MARKET in Gold.
Among those are two key pillars and I quote:
1.) RISING COMMODITY PRICES
2.) A FALLING US DOLLAR
Jim noted that these were present during the great bull market of the late 1970's. Guess what? they were also present during the bull phase of gold which lasted from 2001- 2012 ( it began faltering in 2011).
Ironically or perhaps "Conveniently" would be a better choice of words, both pillars have been conspicuously ABSENT since the Dollar began its strong bull market and the commodity sector began its powerful bear market. ( see my earlier post about the charts).
Yet, those who subscribe to the gold price suppression scheme along the lines as articulated by Paul Craig Roberts, assure us that in spite of the glaring absence of two of their five pillars, the feds are still having to attack the price of gold through their agents, certain banks which are not noted specifically in the Roberts article.
Does not the open-minded reader find this odd to say the least? And I have not even touched on the interest rate component of those Five Pillars.
In other words, the US Dollar has been embarking on a powerful bull market and has gone nearly vertical since July of this year and is currently trading near a FOUR YEAR HIGH and yet Mr. Robert assures at this "attack" on gold by these "agents of the Fed" is being done in order to "protect the value of the Dollar from QE".
Strange deduction from a set of stubborn facts is it not?
But allow me to get back to the key point I wish to make - the gold price suppression scheme proponents tell us that any "illegal" activity that occurs in the Comex gold market is big banks acting as agents of the Fed to discredit the metal and to protect the value of the Dollar.
Remember this story from May of this year dealing with a rogue trader from Barclay's. I well remember it and wrote extensively about it at that time. Please see my comments on this as they are just as apropos about today's UBS story as they were back then. I will stand by my view back then just as strongly as I will stand by my view today.
http://traderdannorcini.blogspot.com/2014/05/ukraine-election-moves-to-forefront.html
The point is very simple - that large speculative forces, in my mind, mainly hedge funds, can move markets or act to influence them is nothing new in our financial markets. Sadly for those of us who prefer open and honest markets, it has been going on for years and will continue into the foreseeable future. However, to jump from that fact, that there is corruption in our financial markets, to the strained conclusion that this is evidence that the big banks are working as agents of the Fed to suppress the price of gold, is an insult to those whose minds can properly attribute cause and effect. It is especially insulting when the Dollar is the strongest currency currently in the world and the price of commodities is falling out of bed, with inflation fears sinking along with it.
If gold were in a bull market, if the Dollar was in a bear market and threatening collapse, if the commodity indices were all sharply rising with hot money flows swamping hard assets as they did a few years ago, if the mining shares were soaring higher, if the Velocity of Money was suggesting serious and possibly out-of-control inflationary forces were present, if REAL interest rates were negative, then perhaps, we could give more credence to the idea that among some of their strategies to deal with those things, an effort to slow down any sharp surge in the price of gold would carry credence with me as it once did some many years ago. Until then, the UBS story just confirms the same thing that most of us who have to make a living in these financial markets know all too well - namely, that the little guy, who is honest and plays by the rules, end up oftentimes donating to the big guys unless he or she is very nimble and can learn to stay clear of the sharks.
Yet, this has an eerie quality about it once more. Why do I say that? Simple - because the entire claim of the Gold is Always Manipulated All The Time crowd ( GIAMATT) is exactly as articulated in the Paul Craig Roberts's article which I refuted in a previous post earlier in the day today. And what is that?
In his own words. Mr. Roberts claims that the big banks ( whom he refers to as 'agents of the Fed' ) are guilty of illegal activity to suppress the price of gold and discredit it. They do this by selling unlimited amounts of paper gold contracts at the Comex ( the scene of the crime according to him and those who view his pronouncements as gospel). The reason they do this is very clearly laid out -
“Eric, it’s clear, this is the Federal Reserve protecting the value of the dollar from quantitative easing and the massive increase in the supply of dollars and dollar-denominated debt.
This is exactly the theme that the gold price suppression scheme advocates have been claiming for years now. Those of you who remember my writings from the earlier days when gold was actually in a bull market, know that I was once a proponent of this theory. At the time, the US Dollar was sinking into oblivion and was threatening a major collapse on the price charts. Gold is the Anti-Dollar so it made perfect sense to me to give support to this view. After all, the feds have stepped into the foreign exchange markets from time to time to address currency valuations as well as form a Treasury Exchange Stabilization Fund known more commonly as the Plunge Protection Team.
However, I parted ways with some of the my former 'friends' over this when the fundamentals behind gold's move higher began to deteriorate and the bull market ended and a new bear market began. There was no longer any reason whatsoever for the feds to try to suppress the rise in the price of gold ( something which they failed to do by the way when the price hit $1900 before finally topping out for good).
Here is a series of questions that none of the gold price suppression scheme advocates will deal with honestly? Why is the Dollar no longer falling against nearly every single currency in the world? Why is the price of nearly every single commodity falling? Why is the TIPs Spread falling? Why is the Velocity of Money falling? Why are the Central Banks desperately trying to fight off Deflationary pressures and longing for their target of 2% inflation and failing to meet it? Why can anyone expect gold to be moving higher in a deflationary environment in which the price of most commodities, especially energy prices, continue to fall?
Keep in mind that none other than Jim Sinclair had written quite elegantly many years earlier about what he correctly termed the FIVE PILLARS of a BULL MARKET in Gold.
Among those are two key pillars and I quote:
1.) RISING COMMODITY PRICES
2.) A FALLING US DOLLAR
Jim noted that these were present during the great bull market of the late 1970's. Guess what? they were also present during the bull phase of gold which lasted from 2001- 2012 ( it began faltering in 2011).
Ironically or perhaps "Conveniently" would be a better choice of words, both pillars have been conspicuously ABSENT since the Dollar began its strong bull market and the commodity sector began its powerful bear market. ( see my earlier post about the charts).
Yet, those who subscribe to the gold price suppression scheme along the lines as articulated by Paul Craig Roberts, assure us that in spite of the glaring absence of two of their five pillars, the feds are still having to attack the price of gold through their agents, certain banks which are not noted specifically in the Roberts article.
Does not the open-minded reader find this odd to say the least? And I have not even touched on the interest rate component of those Five Pillars.
In other words, the US Dollar has been embarking on a powerful bull market and has gone nearly vertical since July of this year and is currently trading near a FOUR YEAR HIGH and yet Mr. Robert assures at this "attack" on gold by these "agents of the Fed" is being done in order to "protect the value of the Dollar from QE".
Strange deduction from a set of stubborn facts is it not?
But allow me to get back to the key point I wish to make - the gold price suppression scheme proponents tell us that any "illegal" activity that occurs in the Comex gold market is big banks acting as agents of the Fed to discredit the metal and to protect the value of the Dollar.
Remember this story from May of this year dealing with a rogue trader from Barclay's. I well remember it and wrote extensively about it at that time. Please see my comments on this as they are just as apropos about today's UBS story as they were back then. I will stand by my view back then just as strongly as I will stand by my view today.
http://traderdannorcini.blogspot.com/2014/05/ukraine-election-moves-to-forefront.html
The point is very simple - that large speculative forces, in my mind, mainly hedge funds, can move markets or act to influence them is nothing new in our financial markets. Sadly for those of us who prefer open and honest markets, it has been going on for years and will continue into the foreseeable future. However, to jump from that fact, that there is corruption in our financial markets, to the strained conclusion that this is evidence that the big banks are working as agents of the Fed to suppress the price of gold, is an insult to those whose minds can properly attribute cause and effect. It is especially insulting when the Dollar is the strongest currency currently in the world and the price of commodities is falling out of bed, with inflation fears sinking along with it.
If gold were in a bull market, if the Dollar was in a bear market and threatening collapse, if the commodity indices were all sharply rising with hot money flows swamping hard assets as they did a few years ago, if the mining shares were soaring higher, if the Velocity of Money was suggesting serious and possibly out-of-control inflationary forces were present, if REAL interest rates were negative, then perhaps, we could give more credence to the idea that among some of their strategies to deal with those things, an effort to slow down any sharp surge in the price of gold would carry credence with me as it once did some many years ago. Until then, the UBS story just confirms the same thing that most of us who have to make a living in these financial markets know all too well - namely, that the little guy, who is honest and plays by the rules, end up oftentimes donating to the big guys unless he or she is very nimble and can learn to stay clear of the sharks.
Paul Craig Roberts and the Spread of Disinformation
Those who have been coming to this site for any length of time know that I make a point of not reading, and especially not referring my readers, to those permanently pro-gold websites which are universally permanently bullish. Almost daily at these sites, there is the propagation of so much error and misinformation when it comes to the futures market that one could spend a lifetime debunking them and still just manage to put a small dent in the sheer quantity of falsehoods emanating outwards. In even referencing them I run the risk of sending more traffic to them and helping to keep them in business; something which I am anxious not to do.
However, one recent article posted on perhaps the most egregious of these sensationalistic pro-gold websites, was so over the top and contained so much disinformation, that I feel compelled to address it directly.
I am referring to the "Shocking Interview" over at King World News ( have you noticed that nearly each and every interview there is always prefaced by an adjective in the superlative? ) where a Paul Craig Roberts, essentially accuses the "agents" ( of the Fed I suppose), also referred to as the banks, as being responsible for "illegal" activity.
Here is his claim:
Evidently Mr. Roberts is upset because the price of gold ( and silver) has been going down and in his mind, it should not be doing that. Therefore he must find a bogeyman to blame. Instead of doing what any self-respecting trader or investor would do when confronted with market action not to their expectation, he digs in deeper and concocts a scenario that reinforces his erroneous thesis and finds solace in that.
The article contains certain presuppositions that are obviously in error.
Let's start with the first one:
"Normally when a central bank creates 4 trillion new dollars, the currency collapses... It's not worth anything ( by this I assume he means the US Dollar) in terms of rubles, euros, yen or (even) pesos.
That is a rather odd statement given the sheer size of the Forex Markets and the price action of the US Dollar. Also, I find it odd that Mr. Roberts chooses to list the Russian Ruble among the currencies that that the "dollar is not worth anything in terms of".
Have any of those who are swallowing this absurd claim happened to look at a recent chart of the Russian Ruble?

Apparently his claim comes as news to the Russian monetary authorities who have been burning through their reserves ever since the sanctions imposed on it from the West have been decimating its currency. They are reported as selling large amounts of their reserves ( including dollar denominated assets) in order to stem the bleeding in their own currency.
It is evident that the Forex markets have a different view of the value of the Dollar against the Russian Ruble than does our esteemed famous currency trader, Mr. Roberts. One can only be kind and hope that he was not actually acting on this bizarre claim that the Ruble has far more value than the US Dollar and was holding a LONG position in the currency. OUCH!
Consider yet further his claim that the Dollar is not worth anything in terms of the Yen.
Here is the Yen chart. This is the Yen versus the Dollar - guess which one is winning and which one is losing.

Note to Mr. Roberts - the entirety of the massive foreign exchange markets happen to strongly disagree with you that the Dollar "is not worth anything in terms of the Yen".
We could do the same thing with the chart of the Euro but I do not want to impose any further on the patience of the reader.
It has never occurred to Mr. Roberts that the Dollar does have value in the eyes of the world's foreign exchange markets and in the world of global investors. The reason for that is simple, even if it seems lost on the hapless Roberts - in spite of its many problems, the US remains the best place for global investors looking for places in which to park capital.
Now as those of us who live in the markets well know, this could change as circumstances and events change as such is the nature of markets, but at the current time, the quaint notion that the Dollar "is not worth anything" is rather amusing, and that is being kind.
Also, Mr. Roberts has the same myopic view of the gold and silver markets as nearly all of those who are permanently bullish the precious metals do - he looks at those markets in isolation and fails to take in the larger picture.
I have demonstrated repeatedly here, to the point of fatigue, that the main problem facing the world's Central Banks is one of DEFLATION, or in their term, Disinflation. Contrary to Mr. Robert's view, it is NOT INFLATION nor is it inflation fears that keep the Central Banks of the West up at night. They would DEARLY LOVE to have this problem. After all, within the span of the last three weeks we have had THREE MAJOR Central Banks all come out with one voice stating that their goal is to generate an inflation rate of 2% annually. I am referring of course to our own Fed, the ECB and the Bank of Japan, which just announced another huge stimulus effort for the entire reason of beating back the deflationary forces which have gripped Japan for so long.
For goodness sake, that someone who once worked at the Treasury department could get something this obvious so dreadfully wrong is rather disconcerting. After all, if this is an example of the caliber of the thinking that is at our current Treasury department we are in more serious trouble than I even imagined. If those running that department cannot even identify the problem, how in the world can they ever be expected to administer the right medicine. Frightening isn't it?
Suffice it to say, the global growth is slowing, in spite of the efforts of Central Banks to reverse it. Their stimulus via QE/low interest rates/treatment of bank reserves, etc. has managed to halt the bleeding but has not in and of itself been able to generate solid, sustained economic growth. The reason for that is that monetary stimulus can in and of itself only do so much; it must be combined with sound fiscal policy and with reforms in the regulatory environment. But that is another topic for another day.
Coming back to the myopic view of Mr. Roberts - he seems genuinely bewildered by the fact that in his mind, demand for physical gold is strong in Asia and yet the metals keep going lower. He therefore jumps to the unproveable conclusion, that is must be "illegal action" that is the cause.
As stated previously, this is what happens when one gets fixated on a single market and fails to survey the entire scene. NO MARKET TRADES IN ISOLATION. If it did, it would be an easy matter for we traders to retire quite early in life. Instead we are forced to deal with winds that blow from many directions at times, each of which can impact the sector we are either attempting to trade or to invest in.
Take a look at the chart of the Goldman Sachs Commodity Index. This is an index comprised of a basket of commodities, each of which are given a particular weighting. Which direction has it been moving, higher or lower?

The answer is evident - lower; and not just lower, but sharply lower. As a matter of FACT, the index just recently hit a 50 month low. If the market is worried about inflation from QE as Mr. Robert is, it certainly is not demonstrating that now is it?
Global growth is slowing and as it slows, demand for all commodities is slowing with it, especially those used in industrial production.
Consider a chart of crude oil, that all important key indicator of economic growth.
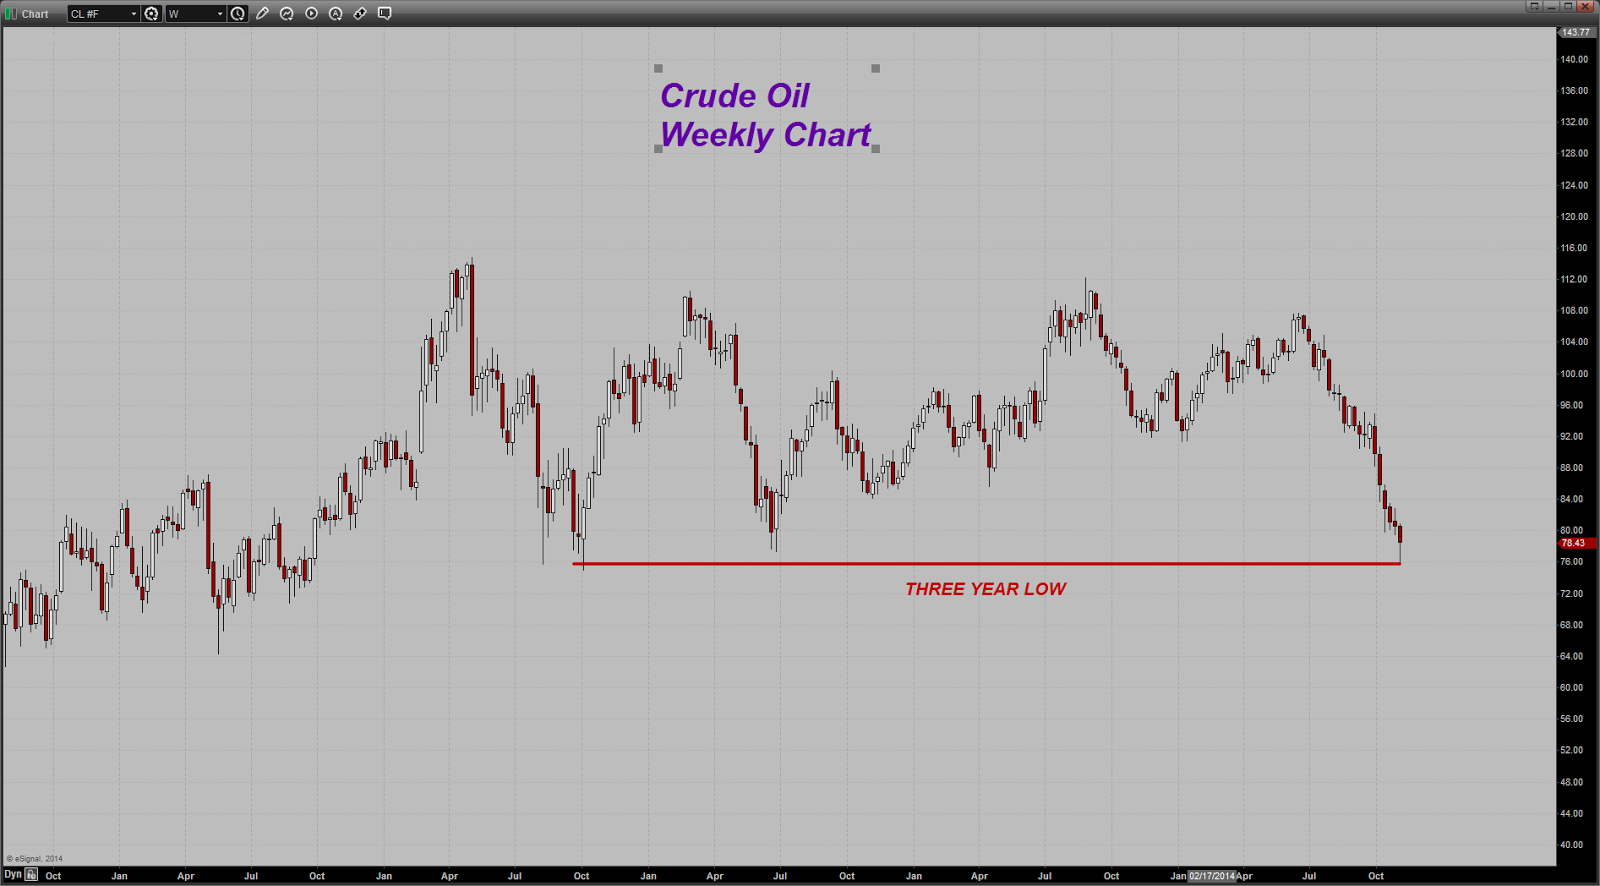
In spite of the fact, that oil too has been succumbing to the general deflationary impulse afflicting the global economy, Mr. Robert assures us that the only reason for lower gold and silver prices must be "illegal activity" on the paper markets.
Following is a chart of the TIPS spread that I have created which the frequent readers of this site have become quite familiar with. This is essentially the market's voice as to how it views the spectre of inflation or lack thereof. When the spread is rising, it shows the market is expecting inflation pressures to build. When it is falling, it shows the opposite, namely, that the market is not worried about inflation.

What has this spread been showing? The answer is falling inflationary fears. The spread just recently put in a multi-year low. Do you also notice the price of gold charted alongside the spread? What has it been doing? Pretty much moving right in sync with the spread, rising when it rises and falling when it falls. The relationship is not a perfect 100% one but it is rather startling how closely the price of gold tracks this all important spread from the bond markets.
Yet, in spite of this, Mr. Robert asserts, with much bravado I might add, that gold prices "are rigged" and that "the authorities are behind it".
I must say, that these authorities are rather remarkable for they have been quite busy apparently! Not only have they been dumping large amounts "into the futures markets during periods of essentially no trading" but they have singlehandedly managed to simultaneously knock down crude oil, unleaded gasoline, corn, wheat, soybeans, heating oil, copper, platinum, etc. at the same time. They have also managed to take the TIPS spread and change its entire direction, when it should be going up - based on Mr. Robert's view - instead of what it is currently doing and going down. They have also managed to push the Russian ruble lower, the yen lower, the Euro lower and nearly every other currency that exists, all against the Dollar, which they have somehow mysteriously managed to levitate in spite of the fact that in Mr. Robert's view, "it has no value".
Quite a feat is it not?
I have already dealt with the reckless claim that it is "the agents of the Fed" or "the banks" as Mr. Roberts claim which have been selling in large quantities during the early morning hours in my frequents posts over the course of the last few years here. Time constraints are precluding me from dealing with it as fully as I would like to but I would suggest that the interested reader simply go back through those many posts and examine the data for themselves.
Let me just make a quick comment along that line and note something out of the Commitment of Traders reports to refute this false claim that it is "the banks" that are the ones doing the selling during the early morning hours to "illegally" control the paper price of gold.
Here is a chart of the NET POSITION of the Commercial Category as well as the Swap Dealers. Look closely at the numbers on the left hand side of the chart and also note the location of the "Zero Line".

As you can see, those numbers are NEGATIVE. What this means, when one sees a RISING LINE for both categories of traders, is that these groups are BUYING, NOT selling, as Mr. Roberts falsely asserts, and I might add here, without the least shred of evidence to back up and support his rash claim. Perhaps he believes that if he simply says it often enough, it will become true by something akin to a reverse statue of limitations.
So then who is doing the selling? Again, what does the data tell us?

This is a chart of the HEDGE FUND NET position in the gold futures market. It has been overlaid with the price of gold showing the linkage. A falling line indicates a reduction in the number of long positions or the addition of new short positions or a combination of both, which is the actual reality. Can you see the exact and perfect correspondence between the selling of this dominant force in our markets and the price of gold? As these speculators exit the gold market in search of other opportunities or as they actively SELL it outright, the price of the metal moves lower. It is that simple.
One last thing and I am done. Mr. Roberts talks a lot about "demand exceeding supply" and as proof of that he refers to the US Mint hitting their quota of coins and the Canadian Royal Mind on "the verge of having to do that". That is all well and good and is certainly noteworthy but what about large speculative Western-based investment demand? Is coin demand the only measure of gold and/or silver demand?
What about the gold ETF and what has happened to it? Did the "agents of the Fed" go in and somehow manage to dupe all those who bought into GLD to somehow throw away their gold? Did these same "agents of the Fed" singlehandedly manage to sell the shares of nearly every single gold mining interest out there? After all, Mr. Roberts refers to the Comex as the scene of "illegal activity" but it is a demonstrably proven fact that the gold mining shares LEAD the price of bullion, whether it is up or down.
Perhaps the truth is much more simple and much less dramatic than "illegal activity on the part of the agents of the Fed". Perhaps it is the fact that with inflation fears sinking, with the Velocity of Money continuing to fall, with global economic growth floundering, with commodity prices worldwide in a general decline, with Central Banks worried about DEFLATION and with stocks being the only game in town in a near zero interest rate environment, that gold and silver have fallen out of favor with large speculative interests who get paid by generating return on capital invested.
If those interests survey the macro economic scene and believe that it is an environment not conducive to rising precious metal prices, and as a result have taken their capital out of gold and silver, and out of commodities in general, and have also decided that the best possible way to profit from them is by actively SHORTING the metals, then perhaps, that is a much easier and more reasonable explanation for the price of the metals to have fallen as they have instead of having to come up with unverifiable claims about "illegal activity".
In closing, I would only say that Mr. Roberts is entitled to believe whatever he wants and to say whatever he wants. He is not, however, entitled to no challenges to his claims.
Gold will have its day once again, but when it does, it will not be in spite of "illegal selling" or some strange suspension of the laws of supply and demand that Mr. Robert claims is occurring but rather because the stars will once again be aligned in favor of the precious metal . At that time the fundamental factors will both dictate higher prices and attract the capital flows from large investors that is necessary for a bull market.
However, one recent article posted on perhaps the most egregious of these sensationalistic pro-gold websites, was so over the top and contained so much disinformation, that I feel compelled to address it directly.
I am referring to the "Shocking Interview" over at King World News ( have you noticed that nearly each and every interview there is always prefaced by an adjective in the superlative? ) where a Paul Craig Roberts, essentially accuses the "agents" ( of the Fed I suppose), also referred to as the banks, as being responsible for "illegal" activity.
Here is his claim:
Apparently these (agent) banks
can print gold futures contracts in unlimited amounts, just as the Federal
Reserve can print U.S. dollars in unlimited amounts. And then in the space of a
minute, two, three, or four minutes, dump the equivalent of 20, 30, 40 (or more)
tons of gold as represented by these paper claims to gold into the futures
markets during periods of essentially no trading. The favorite time is around 3
o’clock in the morning EST. It’s almost always when the Asian physical markets
are closed.
That’s exactly what’s going on. It’s illegal. It’s not
merely unethical -- it’s strictly illegal. But it’s being done by the
authorities, or with their permission."
The article contains certain presuppositions that are obviously in error.
Let's start with the first one:
"Normally when a central bank creates 4 trillion new dollars, the currency collapses... It's not worth anything ( by this I assume he means the US Dollar) in terms of rubles, euros, yen or (even) pesos.
That is a rather odd statement given the sheer size of the Forex Markets and the price action of the US Dollar. Also, I find it odd that Mr. Roberts chooses to list the Russian Ruble among the currencies that that the "dollar is not worth anything in terms of".
Have any of those who are swallowing this absurd claim happened to look at a recent chart of the Russian Ruble?
Apparently his claim comes as news to the Russian monetary authorities who have been burning through their reserves ever since the sanctions imposed on it from the West have been decimating its currency. They are reported as selling large amounts of their reserves ( including dollar denominated assets) in order to stem the bleeding in their own currency.
It is evident that the Forex markets have a different view of the value of the Dollar against the Russian Ruble than does our esteemed famous currency trader, Mr. Roberts. One can only be kind and hope that he was not actually acting on this bizarre claim that the Ruble has far more value than the US Dollar and was holding a LONG position in the currency. OUCH!
Consider yet further his claim that the Dollar is not worth anything in terms of the Yen.
Here is the Yen chart. This is the Yen versus the Dollar - guess which one is winning and which one is losing.
Note to Mr. Roberts - the entirety of the massive foreign exchange markets happen to strongly disagree with you that the Dollar "is not worth anything in terms of the Yen".
We could do the same thing with the chart of the Euro but I do not want to impose any further on the patience of the reader.
It has never occurred to Mr. Roberts that the Dollar does have value in the eyes of the world's foreign exchange markets and in the world of global investors. The reason for that is simple, even if it seems lost on the hapless Roberts - in spite of its many problems, the US remains the best place for global investors looking for places in which to park capital.
Now as those of us who live in the markets well know, this could change as circumstances and events change as such is the nature of markets, but at the current time, the quaint notion that the Dollar "is not worth anything" is rather amusing, and that is being kind.
Also, Mr. Roberts has the same myopic view of the gold and silver markets as nearly all of those who are permanently bullish the precious metals do - he looks at those markets in isolation and fails to take in the larger picture.
I have demonstrated repeatedly here, to the point of fatigue, that the main problem facing the world's Central Banks is one of DEFLATION, or in their term, Disinflation. Contrary to Mr. Robert's view, it is NOT INFLATION nor is it inflation fears that keep the Central Banks of the West up at night. They would DEARLY LOVE to have this problem. After all, within the span of the last three weeks we have had THREE MAJOR Central Banks all come out with one voice stating that their goal is to generate an inflation rate of 2% annually. I am referring of course to our own Fed, the ECB and the Bank of Japan, which just announced another huge stimulus effort for the entire reason of beating back the deflationary forces which have gripped Japan for so long.
For goodness sake, that someone who once worked at the Treasury department could get something this obvious so dreadfully wrong is rather disconcerting. After all, if this is an example of the caliber of the thinking that is at our current Treasury department we are in more serious trouble than I even imagined. If those running that department cannot even identify the problem, how in the world can they ever be expected to administer the right medicine. Frightening isn't it?
Suffice it to say, the global growth is slowing, in spite of the efforts of Central Banks to reverse it. Their stimulus via QE/low interest rates/treatment of bank reserves, etc. has managed to halt the bleeding but has not in and of itself been able to generate solid, sustained economic growth. The reason for that is that monetary stimulus can in and of itself only do so much; it must be combined with sound fiscal policy and with reforms in the regulatory environment. But that is another topic for another day.
Coming back to the myopic view of Mr. Roberts - he seems genuinely bewildered by the fact that in his mind, demand for physical gold is strong in Asia and yet the metals keep going lower. He therefore jumps to the unproveable conclusion, that is must be "illegal action" that is the cause.
As stated previously, this is what happens when one gets fixated on a single market and fails to survey the entire scene. NO MARKET TRADES IN ISOLATION. If it did, it would be an easy matter for we traders to retire quite early in life. Instead we are forced to deal with winds that blow from many directions at times, each of which can impact the sector we are either attempting to trade or to invest in.
Take a look at the chart of the Goldman Sachs Commodity Index. This is an index comprised of a basket of commodities, each of which are given a particular weighting. Which direction has it been moving, higher or lower?
The answer is evident - lower; and not just lower, but sharply lower. As a matter of FACT, the index just recently hit a 50 month low. If the market is worried about inflation from QE as Mr. Robert is, it certainly is not demonstrating that now is it?
Global growth is slowing and as it slows, demand for all commodities is slowing with it, especially those used in industrial production.
Consider a chart of crude oil, that all important key indicator of economic growth.
In spite of the fact, that oil too has been succumbing to the general deflationary impulse afflicting the global economy, Mr. Robert assures us that the only reason for lower gold and silver prices must be "illegal activity" on the paper markets.
Following is a chart of the TIPS spread that I have created which the frequent readers of this site have become quite familiar with. This is essentially the market's voice as to how it views the spectre of inflation or lack thereof. When the spread is rising, it shows the market is expecting inflation pressures to build. When it is falling, it shows the opposite, namely, that the market is not worried about inflation.
What has this spread been showing? The answer is falling inflationary fears. The spread just recently put in a multi-year low. Do you also notice the price of gold charted alongside the spread? What has it been doing? Pretty much moving right in sync with the spread, rising when it rises and falling when it falls. The relationship is not a perfect 100% one but it is rather startling how closely the price of gold tracks this all important spread from the bond markets.
Yet, in spite of this, Mr. Robert asserts, with much bravado I might add, that gold prices "are rigged" and that "the authorities are behind it".
I must say, that these authorities are rather remarkable for they have been quite busy apparently! Not only have they been dumping large amounts "into the futures markets during periods of essentially no trading" but they have singlehandedly managed to simultaneously knock down crude oil, unleaded gasoline, corn, wheat, soybeans, heating oil, copper, platinum, etc. at the same time. They have also managed to take the TIPS spread and change its entire direction, when it should be going up - based on Mr. Robert's view - instead of what it is currently doing and going down. They have also managed to push the Russian ruble lower, the yen lower, the Euro lower and nearly every other currency that exists, all against the Dollar, which they have somehow mysteriously managed to levitate in spite of the fact that in Mr. Robert's view, "it has no value".
Quite a feat is it not?
I have already dealt with the reckless claim that it is "the agents of the Fed" or "the banks" as Mr. Roberts claim which have been selling in large quantities during the early morning hours in my frequents posts over the course of the last few years here. Time constraints are precluding me from dealing with it as fully as I would like to but I would suggest that the interested reader simply go back through those many posts and examine the data for themselves.
Let me just make a quick comment along that line and note something out of the Commitment of Traders reports to refute this false claim that it is "the banks" that are the ones doing the selling during the early morning hours to "illegally" control the paper price of gold.
Here is a chart of the NET POSITION of the Commercial Category as well as the Swap Dealers. Look closely at the numbers on the left hand side of the chart and also note the location of the "Zero Line".
As you can see, those numbers are NEGATIVE. What this means, when one sees a RISING LINE for both categories of traders, is that these groups are BUYING, NOT selling, as Mr. Roberts falsely asserts, and I might add here, without the least shred of evidence to back up and support his rash claim. Perhaps he believes that if he simply says it often enough, it will become true by something akin to a reverse statue of limitations.
So then who is doing the selling? Again, what does the data tell us?
This is a chart of the HEDGE FUND NET position in the gold futures market. It has been overlaid with the price of gold showing the linkage. A falling line indicates a reduction in the number of long positions or the addition of new short positions or a combination of both, which is the actual reality. Can you see the exact and perfect correspondence between the selling of this dominant force in our markets and the price of gold? As these speculators exit the gold market in search of other opportunities or as they actively SELL it outright, the price of the metal moves lower. It is that simple.
One last thing and I am done. Mr. Roberts talks a lot about "demand exceeding supply" and as proof of that he refers to the US Mint hitting their quota of coins and the Canadian Royal Mind on "the verge of having to do that". That is all well and good and is certainly noteworthy but what about large speculative Western-based investment demand? Is coin demand the only measure of gold and/or silver demand?
What about the gold ETF and what has happened to it? Did the "agents of the Fed" go in and somehow manage to dupe all those who bought into GLD to somehow throw away their gold? Did these same "agents of the Fed" singlehandedly manage to sell the shares of nearly every single gold mining interest out there? After all, Mr. Roberts refers to the Comex as the scene of "illegal activity" but it is a demonstrably proven fact that the gold mining shares LEAD the price of bullion, whether it is up or down.
Perhaps the truth is much more simple and much less dramatic than "illegal activity on the part of the agents of the Fed". Perhaps it is the fact that with inflation fears sinking, with the Velocity of Money continuing to fall, with global economic growth floundering, with commodity prices worldwide in a general decline, with Central Banks worried about DEFLATION and with stocks being the only game in town in a near zero interest rate environment, that gold and silver have fallen out of favor with large speculative interests who get paid by generating return on capital invested.
If those interests survey the macro economic scene and believe that it is an environment not conducive to rising precious metal prices, and as a result have taken their capital out of gold and silver, and out of commodities in general, and have also decided that the best possible way to profit from them is by actively SHORTING the metals, then perhaps, that is a much easier and more reasonable explanation for the price of the metals to have fallen as they have instead of having to come up with unverifiable claims about "illegal activity".
In closing, I would only say that Mr. Roberts is entitled to believe whatever he wants and to say whatever he wants. He is not, however, entitled to no challenges to his claims.
Gold will have its day once again, but when it does, it will not be in spite of "illegal selling" or some strange suspension of the laws of supply and demand that Mr. Robert claims is occurring but rather because the stars will once again be aligned in favor of the precious metal . At that time the fundamental factors will both dictate higher prices and attract the capital flows from large investors that is necessary for a bull market.
Friday, November 7, 2014
Copper COT Anomaly
Tracking the copper market over this past year has been a rather fascinating study for me as it has produced some very unusual readings that do not occur very often.
I made mention of one such development earlier this year when noting the "Dueling Speculators" scenario in which the hedge funds were on one side of the market while the other large specs such as floor traders, non-registered CTA's and other private traders of size, were arrayed on the opposite.
Now we have yet another rather fascinating occurrence to note. This time it involves the fact that out of the 5 categories of traders that are reported and broken down, all but one are on the net short side of the market. The category carrying the entire weight of the net long position in the market is the Swap Dealers.

The Commercials - Producer/User/Merchant/Processor are net short along with the hedge funds, other large reportables and the general public. I am not sure why this is the case here with copper but it has been the norm for this year to see the Swap Dealers opposite the Commercial category. Both tend to generally be more closely aligned as to the same side of the market, although I wish to emphasize that it is not always the case nor does it need to be.
But it does strike me as rather odd to see the current configuration.
Here is the actual price chart.

As you can see, the market has essentially been slowly grinding lower since January 2012. There is a channel defined but the upward movement has been growing more shallow this year and has not been able to make it to the upper channel line. That is a sign of persistent weakness.
Thus far those on the short side of the market have been on the correct side although the market has not made it easy at times. It has been under $3.00 only briefly before popping higher but over the last month it has made several trips below $3.00 more frequently than at any time in many years. This is a testimony in my view to the overall sluggish nature of the global economy.
Will this market go in the direction in which the 4 categories are positioned and finally mount a weekly CLOSE below $3.00? I do not know but if it does, it will bode poorly for growth prospects.

While such an occurrence might unnerve some, it should be pointed out that it was not until the middle of 2005, that copper prices began any sort of deviation from its historical norm when it comes to price. Just look at the chart going all the way back to 1992 and you will see what I mean.
Copper at $2.00 is not exactly cheap when compared to the 13 years prior to the breakout in 2005. Maybe copper is reverting back more towards its historical average when it comes to price. If that is the case, $3.00 copper might still be considered rather expensive.
All this of course is dependent heavily on what happens in China but I can tell you this, if growth were to slow at a faster rate in China, and again, no one knows for sure what will happen there, but if it does, copper prices would have some substantial room yet on the downside. That rectangular support zone noted on the chart might just not hold after all!
We are all certainly going to see one way or the other. As a matter of fact, I suspect our monetary masters are also keeping a close eye on this chart, along with that of the crude oil markets I might add.
I made mention of one such development earlier this year when noting the "Dueling Speculators" scenario in which the hedge funds were on one side of the market while the other large specs such as floor traders, non-registered CTA's and other private traders of size, were arrayed on the opposite.
Now we have yet another rather fascinating occurrence to note. This time it involves the fact that out of the 5 categories of traders that are reported and broken down, all but one are on the net short side of the market. The category carrying the entire weight of the net long position in the market is the Swap Dealers.
The Commercials - Producer/User/Merchant/Processor are net short along with the hedge funds, other large reportables and the general public. I am not sure why this is the case here with copper but it has been the norm for this year to see the Swap Dealers opposite the Commercial category. Both tend to generally be more closely aligned as to the same side of the market, although I wish to emphasize that it is not always the case nor does it need to be.
But it does strike me as rather odd to see the current configuration.
Here is the actual price chart.
As you can see, the market has essentially been slowly grinding lower since January 2012. There is a channel defined but the upward movement has been growing more shallow this year and has not been able to make it to the upper channel line. That is a sign of persistent weakness.
Thus far those on the short side of the market have been on the correct side although the market has not made it easy at times. It has been under $3.00 only briefly before popping higher but over the last month it has made several trips below $3.00 more frequently than at any time in many years. This is a testimony in my view to the overall sluggish nature of the global economy.
Will this market go in the direction in which the 4 categories are positioned and finally mount a weekly CLOSE below $3.00? I do not know but if it does, it will bode poorly for growth prospects.
While such an occurrence might unnerve some, it should be pointed out that it was not until the middle of 2005, that copper prices began any sort of deviation from its historical norm when it comes to price. Just look at the chart going all the way back to 1992 and you will see what I mean.
Copper at $2.00 is not exactly cheap when compared to the 13 years prior to the breakout in 2005. Maybe copper is reverting back more towards its historical average when it comes to price. If that is the case, $3.00 copper might still be considered rather expensive.
All this of course is dependent heavily on what happens in China but I can tell you this, if growth were to slow at a faster rate in China, and again, no one knows for sure what will happen there, but if it does, copper prices would have some substantial room yet on the downside. That rectangular support zone noted on the chart might just not hold after all!
We are all certainly going to see one way or the other. As a matter of fact, I suspect our monetary masters are also keeping a close eye on this chart, along with that of the crude oil markets I might add.
GLD to Gold - We have a Problem!
Once again we have another one of those proverbial flies in the ointment when it comes to one of these frequent rallies we have seen in gold during the ongoing bear market of the last two+ years. We get a great rally and a lot of powerful chart action over at the Comex only to wait upon the reported holdings update from GLD and then find disappointment.
Instead of a nice climb in the holdings, what did we get instead? _ a fall of some 5.7 tons! Quite honestly, that came as a very big surprise to me. Given the action in the mining shares, I had expected to see some increase in the holdings. 'Twas not to be apparently.
This confirms my concerns about the rally - namely that while it was indeed powerful, it was due primarily to short covering and not so much due to an abundance of new buying. It is obvious that some used the rally in gold to close out some longs in the GLD.
Here is the chart. Gold holdings are now DOWN 71.07 tons from the first of the year ( and going in the wrong direction) while reaching back to levels last seen in late September 2008.

I am going to keep a very close eye on this next week and can only hope that we get some regular numbers reported daily from the ETF. Those of you who tend to follow that thing as I do know that we can sometimes go days without any fresh numbers coming our way.
Instead of a nice climb in the holdings, what did we get instead? _ a fall of some 5.7 tons! Quite honestly, that came as a very big surprise to me. Given the action in the mining shares, I had expected to see some increase in the holdings. 'Twas not to be apparently.
This confirms my concerns about the rally - namely that while it was indeed powerful, it was due primarily to short covering and not so much due to an abundance of new buying. It is obvious that some used the rally in gold to close out some longs in the GLD.
Here is the chart. Gold holdings are now DOWN 71.07 tons from the first of the year ( and going in the wrong direction) while reaching back to levels last seen in late September 2008.
I am going to keep a very close eye on this next week and can only hope that we get some regular numbers reported daily from the ETF. Those of you who tend to follow that thing as I do know that we can sometimes go days without any fresh numbers coming our way.
Some Thoughts on Corn and the Commitment of Traders
Those of you who trade the grains as I do are well aware of the importance of this Monday's upcoming USDA grains report. We will get a fresh look at the yield numbers and the overall size of the crop based on the latest from USDA as well as what the expected changes in the final carryover will be for the 2014-2015 marketing year.
It is no secret that we are expecting record corn and bean crops. The only question is what size? Traders such as myself are going to be especially interested in the carryover numbers expected.
Heading into this report however, we have had a huge rally in the bean complex as well as generally higher prices in corn, after it made a low near $3.20 at the beginning of October. It has since rallied some $0.60 higher in the face of a record crop which has most traders confounded and left scratching their heads looking for a reason to justify a move of this extent.
It did back down a bit this week as expectations began to circulate that we would get some higher numbers based on what the private firms were saying as well as some anecdotal type reports from long-time crop watchers/observers.
I want to make an especial note that these USDA reports more often than not produce some violent moves. Many traders tend to move to the sidelines ahead of them therefore to avoid getting caught in the usual crossfire that erupts when the numbers hit the wires.
I have noticed something however that I feel is worth mentioning. In going over the Commitment of Traders reports, I was struck by the size of the NET LONG positioning of the LARGE SPECS heading into this report. To put it bluntly, they are banking on a very bullish report.
Take a look at the following COT chart and note the blue line. That is the combined NET position of the LARGE SPEC category. As of Tuesday this week, it is the largest it has been since May of this year. As a matter of fact, it is at levels commensurate with late May when they began to exit and move out from their heavy long side exposure in earnest, eventually reaching a net short position in the process. ( NOTE the price chart where this is detailed).
Here is what should make any trader a bit nervous about this...


If this report is not strongly bullish, given the fact that corn has rallied to the extent it has over the last 5 weeks, one has to be concerned that there is now a hefty contingent of these large specs sitting on the net long side of the market waiting for this report to essentially confirm their bullish bias. While the report may yet to prove bullish, it is going to take a much lower than expected yield, a lower ending carryover, or a lower planted/harvested acreage number than what the market has built in heading into this report to provide the additional fuel required to push this market much higher in my view.
As I see this thing, the corn has essentially been pulled higher by the antics of the meal market, which as I have been commenting rather frequently of late, has been dragging the entire grain floor higher alongside of it. The strong fund buying in the meal then spilled into the beans, which then spilled into the corn.
But here is the interesting thing - the number of OUTRIGHT LARGE SPEC LONGS has not seen near the volatility as has the number of OUTRIGHT SHORTS. Look at how relatively stable the long positions have been versus the sharp moves up and down in the number of outright short positions.

To put it bluntly, the vast majority of this move in corn, both down from its peak in May and now HIGHER, from its valley in October, has been caused by sharp fluctuations in the number of short positions held by these large speculators which dominate our markets.
It has been my experience that a market which moves higher due more to the fact of an overwhelmingly larger amount of short covering, than BRAND NEW LONG POSITIONS being added, lacks the necessary ingredients to support a bullish trend remaining intact. In other words, that move is suspect.
Those of you who have been reading here for any length of time at the site, know quite well that I have often commented on the inability of gold to sustain rallies due to the fact that the largest component of the move higher during the current bear market has been based on short covering and not NEW LONG positions.
I suspect the same thing with corn. When the shorts are finished being run out, who is left to buy up at these levels? Answer - not many, especially when they realize that a record crop is coming. For now, the bulls, aided by nervous shorts, have been able to push this market well off the low made in early October as the final size of the crop was becoming known. Harvest delays, meal rallies, etc, have been the fundamental justification to support that rally.
Will the report we get this coming Monday turn out to be the swan song for the large specs or will they be proven to have been correct? We shall certainly see.
It is no secret that we are expecting record corn and bean crops. The only question is what size? Traders such as myself are going to be especially interested in the carryover numbers expected.
Heading into this report however, we have had a huge rally in the bean complex as well as generally higher prices in corn, after it made a low near $3.20 at the beginning of October. It has since rallied some $0.60 higher in the face of a record crop which has most traders confounded and left scratching their heads looking for a reason to justify a move of this extent.
It did back down a bit this week as expectations began to circulate that we would get some higher numbers based on what the private firms were saying as well as some anecdotal type reports from long-time crop watchers/observers.
I want to make an especial note that these USDA reports more often than not produce some violent moves. Many traders tend to move to the sidelines ahead of them therefore to avoid getting caught in the usual crossfire that erupts when the numbers hit the wires.
I have noticed something however that I feel is worth mentioning. In going over the Commitment of Traders reports, I was struck by the size of the NET LONG positioning of the LARGE SPECS heading into this report. To put it bluntly, they are banking on a very bullish report.
Take a look at the following COT chart and note the blue line. That is the combined NET position of the LARGE SPEC category. As of Tuesday this week, it is the largest it has been since May of this year. As a matter of fact, it is at levels commensurate with late May when they began to exit and move out from their heavy long side exposure in earnest, eventually reaching a net short position in the process. ( NOTE the price chart where this is detailed).
Here is what should make any trader a bit nervous about this...
If this report is not strongly bullish, given the fact that corn has rallied to the extent it has over the last 5 weeks, one has to be concerned that there is now a hefty contingent of these large specs sitting on the net long side of the market waiting for this report to essentially confirm their bullish bias. While the report may yet to prove bullish, it is going to take a much lower than expected yield, a lower ending carryover, or a lower planted/harvested acreage number than what the market has built in heading into this report to provide the additional fuel required to push this market much higher in my view.
As I see this thing, the corn has essentially been pulled higher by the antics of the meal market, which as I have been commenting rather frequently of late, has been dragging the entire grain floor higher alongside of it. The strong fund buying in the meal then spilled into the beans, which then spilled into the corn.
But here is the interesting thing - the number of OUTRIGHT LARGE SPEC LONGS has not seen near the volatility as has the number of OUTRIGHT SHORTS. Look at how relatively stable the long positions have been versus the sharp moves up and down in the number of outright short positions.
To put it bluntly, the vast majority of this move in corn, both down from its peak in May and now HIGHER, from its valley in October, has been caused by sharp fluctuations in the number of short positions held by these large speculators which dominate our markets.
It has been my experience that a market which moves higher due more to the fact of an overwhelmingly larger amount of short covering, than BRAND NEW LONG POSITIONS being added, lacks the necessary ingredients to support a bullish trend remaining intact. In other words, that move is suspect.
Those of you who have been reading here for any length of time at the site, know quite well that I have often commented on the inability of gold to sustain rallies due to the fact that the largest component of the move higher during the current bear market has been based on short covering and not NEW LONG positions.
I suspect the same thing with corn. When the shorts are finished being run out, who is left to buy up at these levels? Answer - not many, especially when they realize that a record crop is coming. For now, the bulls, aided by nervous shorts, have been able to push this market well off the low made in early October as the final size of the crop was becoming known. Harvest delays, meal rallies, etc, have been the fundamental justification to support that rally.
Will the report we get this coming Monday turn out to be the swan song for the large specs or will they be proven to have been correct? We shall certainly see.
Subscribe to:
Posts (Atom)