"When misguided public opinion honors what is despicable and despises what is honorable, punishes virtue and rewards vice, encourages what is harmful and discourages what is useful, applauds falsehood and smothers truth under indifference or insult, a nation turns its back on progress and can be restored only by the terrible lessons of catastrophe." … Frederic Bastiat
Evil talks about tolerance only when it’s weak. When it gains the upper hand, its vanity always requires the destruction of the good and the innocent, because the example of good and innocent lives is an ongoing witness against it. So it always has been. So it always will be. And America has no special immunity to becoming an enemy of its own founding beliefs about human freedom, human dignity, the limited power of the state, and the sovereignty of God. – Archbishop Chaput
Trader Dan's Work is NOW AVAILABLE AT WWW.TRADERDAN.NET
Here are the numbers for this past week that USDA released this afternoon:
CORN
The crop retained its stellar rating at 74% rated Good/Excellent compared to last week.
The recent warm, dry weather did wonders to speed along the crop towards maturity with 96% of the crop dented compared to 90% last week and 95% last year at this time. The five year average is 97%.
60% of the crop is now fully mature compared to 42% last week and 60% last year. The five year average is 70%.
12% of the crop has been harvested compared to 7% last week and 11% last year at this time. The five year average is 23%.
The northern tier states are behind which is the reason that traders are reluctant to keep pressure on the corn right now as they want to see the % harvested move higher ahead of any potential wetness or killing freezes. That is giving the corn some lingering weather premium.
However, it should be noted that in those areas where harvest is either ongoing or has been completed, reported yields are coming in very, very strong.
SOYBEANS
The bean crop actually improved slightly this past week with 72% rated Good/Excellent compared to 71% last week. The Excellent category is where the increase came from as it gained 1% to 19 from 18 the previous week.
69% of the crop is now dropping leaves compared to 45% last week and 64% a year ago. The five year average is 71%.
On the harvest front - 10% of the bean crop has been harvested compared to 3% a week ago and 10% a year ago at the same time. The five year average is 17%.
'
About the same thing on the bean harvest as for the corn - it is lagging the 5 year average in some of the more northern states in particular but yields thus far that are coming in are incredibly high.
The market decided to move higher today ahead of tomorrow's USDA stockpiles report. the last number we had for old crop supplies stood at 130 million bushels. Some shorts decided to get out ahead of that number. I am not sure why anyone is especially interested in the old crop carryover at this point ahead of a carryover that is expected to be more than 3X that number but it could be some end of the quarter/month movement was involved here as well.
This afternoon's progress/condition reports show crops in outstanding condition and an ongoing harvest. Traders will react to any potential for harvest disruptions or freezes but unless any sort of hard freeze comes prior to the middle of this month, at this point, I do not believe it will make much difference in the general scheme of things. We'll see as we move forward.
One last thing - the corn/wheat spread continues to move against corn and in favor of wheat as it had started to do last week. I am watching wheat prices carefully to see if there is anything that might indicate a bottom is in for this market. Right now the chart is showing some decidedly bullish divergence on the RSI but the chart has not shown any confirmation of that in the form of a break over overhead resistance. A change in the handle from one of a "4" to that of a "5" might pique some interest among momentum-based buyers but for now the market is still in a bear trend undergoing some mild corrections higher.
What showed something similar in July and managed to rally about $0.40 before succumbing to another round of strong selling. It could conceivably rally to $5.00 but one would expect fresh selling to show up once again unless something had changed on the fundamental front.
Strength in the US Dollar has negated a considerable portion of the downdraft in US wheat prices.
Let's watch this however...( along with cattle for any sign of a blow off top which finally runs out of upside steam ).
On the hogs, the report has cast a bearish pall over that complex that will linger for a while but for the time being, the cash markets remain strong and with the board at a discount to the cash, we will need to see that turn before we can any move aggressive selling in this market. Expansion is here however and is not going away anytime soon. That is good news for those of us who are getting tired of paying the proverbial arm and leg for red meat.
Hey - Tuna Helper is looking pretty good right now! It's too bad beef is a perishable commodity because buying it last year and holding it would have been a helluva lot better than "stackin' gold". On second thought, I sense some real potential here for any newsletter writers who want to concoct some theories about Beef Backwardation ( notice how catching the "B and B" sounds), or Famed Cattle Insider claims Massive Beef Buying seen at Costco. How did I ever miss such an opportunity?! He could also claim that he just narrowly missed being hit by a runaway forklift driver who was moving dead carcasses at the feedlot where he was conducting undercover surveillance as part of his whistleblower activities!
Bulls in the cattle market, (both fats and feeders) have had an excellent run higher for some time. Scarce supplies coming off of back to back drought years ( 2011 and 2102) have reduced the herd significantly. Now that cattlemen are looking to rebuild their herds, on account of the incredibly cheap grain prices and sky high cattle prices, supplies are becoming even tighter as heifers are being held back for breeding purposes. Also, feeders are in hot demand and have drawn record prices at auction barns.
However, it is my view that cattle longs should be careful at this point. The market looks as if it is beginning to accelerate with shorts being "butchered" ( a little word play here for fun ) and now abandoning the ship as the hedge fund longs squeeze them mercilessly.
Markets undergoing this sort of internal dynamic are very dangerous if one is long. Once the last of the weak shorts are run out, they can abruptly change direction. If you are long, I would suggest you think about locking in some profits through the use of some options.
With both hog and chicken numbers ramping up and with US beef so pricey and with a strong US Dollar, the demand side of this market is going to have to deal with some hefty headwinds soon enough. For now, the funds are in the driver's seat but all good things come to an end.
Feeders in particular are in nosebleed territory. They closed limit up on Friday of last week and are currently locked at limit up today. This market in particular is displaying all the classic signs of a blow off run.
I still do not see any technical evidence yet of a top but I am watching very, very closely at this point.
Here is the October live cattle chart. Bulls are banking on the fact that the scarcity of cattle will allow for even higher prices. Bears are of the view that increasing cattle weights and high priced beef will overwhelm demand at these levels. I am in the latter camp but am not ready to pull the trigger just yet.
Some of what we are seeing today in the livestock market is month-end and quarter-end window dressing by funds who are heavily long both markets, as well as the hogs.
That negative Hogs and Pigs Report forced a limit down opening in some of the summer month contracts but funds came in and once again vigorously defended that big long position they have amassed. The hog market has been able to shrug off the report, especially in the nearby October which is being supported by surging pork prices ( end users are switching from high priced beef to pork) but one wonders how long even this month contract will be able to shrug off the broader based commodity selling trend.
I am not going to put too much stock in price action in any commodity market both today and tomorrow due to Quarter end activity; nonetheless, we do want to pay close attention to the price action throughout the rest of the week in these particular markets.
If cattle feeders can force packers to put higher money on the table, hedge fund longs will be able to continue squeezing the shorts. If feedlots blink first, hedge funds are in trouble. We'll see how the battle plays itself out soon enough.
Also, this afternoon we will get another look at harvest progress from the USDA. There is some rain in the forecast for later this week which has spooked some bears ( also a report is due out ) and that is leading to a pop higher in the grain markets this morning.
The Mato Grosso area of Brazil is forecasted to receive some good rains. That will help with overall soil moisture. Planting season is underway down in S. America with traders expecting some big acreage going to beans.
That 6 year low in the Brazilian Real has really gotten my attention.
If one just looks at the Major Currency pairs and sees the Dollar a bit weaker this morning, it is very easy to overlook at what has been happening in some of the Emerging Market currencies. It goes back to that same interest rate differential and the fact that there is concern about slowing global growth, especially in some of these emerging markets. I should also note that there has been a large carry trade involved here as well.
I want to post a chart of the Brazilian Real for the benefit of grain traders and hog traders.
Please note that the currency just made a 6 year low against the US Dollar. Brazilian grain and Brazilian pork are dirt cheap on the global markets compared to US grains and US pork. Most US based grain traders have been in the past, and remain oblivious to such things.
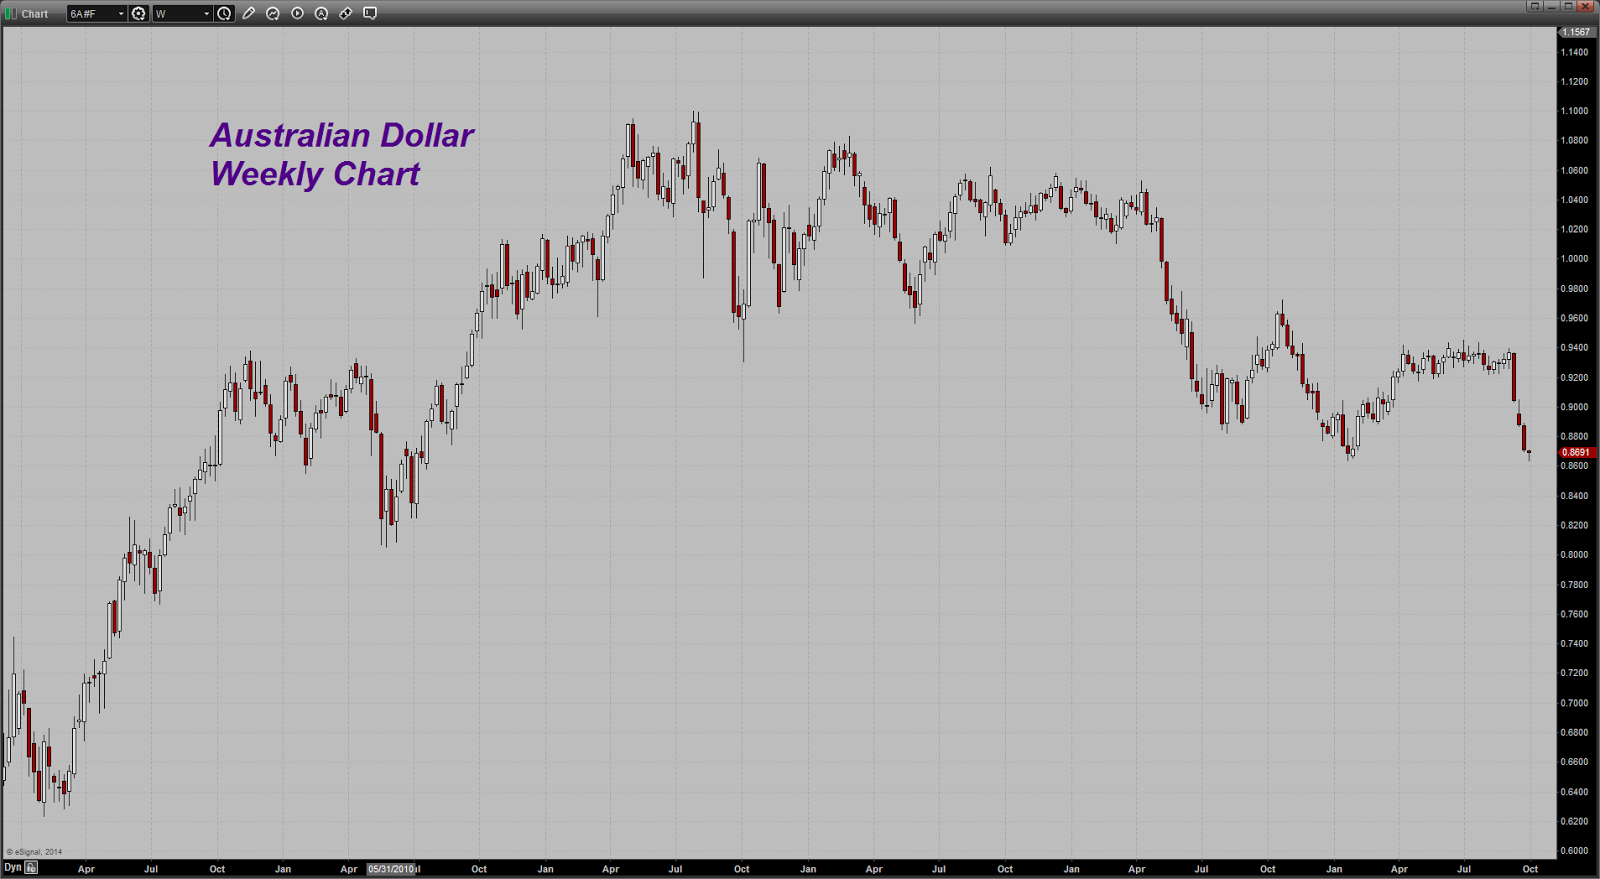
Also, while not an emerging market, the Australian Dollar just matched its yearly low against the greenback. If it moves lower from here, we are talking about 4 year lows. Aussie beef is getting cheaper! It is only a matter of time before high-priced US Beef is going to price itself out of export demand.
It has been some time since I have posted a LONG TERM ( monthly ) chart for gold. I have been using the weekly and daily time frames for analysis purpose but I wanted to take the opportunity to answer - in this format - my critics and those who continue to deny that gold is currently in a bear market.
Over and over again, we get the same worn-out trite from the gold perma-bulls, that "any day now" gold is going to launch and that the current sell off is a GREAT BUYING opportunity.
This is coming from the same people who also have been assuring us for the last THREE YEARS that based on one wild theory and reckless claim after another, that a big short squeeze was imminent and that the "smart investor" should be buying. They told us this at $1800, then at $1700, then at $1600, most certainly at $1500, again at $1400, screamed even louder at $1300 and now they are down to dealing with $1200.
Every time, it is the same foolish and wild claim - "based on such and such theory or such and such "insider" information, gold is getting ready to launch.
How many of these theories have we tried to debunk over here, incurring as the result the wrath and ire of the gold cult members. Let me name a few once more and recall the breathless and dogmatic pronouncements, as if from on high, that once the markets understood this secret gnosis that only those advocating these things were privy to, it was "the sky is the limit" for gold prices.
Merely listing them here brings back the many battles we have had to fight to dispel these things.
1.) Gold Backwardation
2.) Negative GOFO rates
3.) JP Morgan long side corner of the gold market
4.) Shrinking Comex warehouse numbers
5.) Swap Dealers on the Long side
6.) Hedge funds on the short side ( imminent short covering squeeze)
7.) Death of the Dollar
8.) Phony Inflation statistics
9.) Bank Bail-ins.
10.) WWIII with Russia
11.)
Self proclaimed insider London trader and whistleblower tossing around esoteric claims of huge tonnage of gold buys by "smart money"
12.) Ad infinitum, ad nauseam
If I have left off any of them or forgot any, I am hoping the readers will supply them.
Coincidentally enough, those advocating these theories tend to all have one thing in common - they make money by selling gold, gold-oriented newsletters, gold-oriented website subscriptions or per-click advertising fees, gold-mining oriented mutual funds, gold-oriented physical gold funds, etc.
In other words, all of those pushing these claims and theories, tend to profit as long as they have a steady steam of gullible people that they can separate from their money. They simply CANNOT BE OBJECTIVE. Once the public is convinced that the bull market in the precious metals is over and therefore loses interest in what they are selling, their livelihoods are impacted negatively. What is required therefore is a steady, incessant birthing of new stories, new theories, new claims, to keep the fire of fear ( and greed) alive.
With that in mind, here is a LONG TERM or MONTHLY Chart of gold. I have noted several key areas for the reader. Of course, in hindsight, all these things are clear that were murky at the moment, but that is the beauty of a long term price chart - it provides an unbiased, objective, hard-nosed view of things that anyone without a bias, can easily perceive if they approach it with an open mind.
Note first the "SECONDARY TOP" made two years ago to this very month at the $1800 mark. That is a near picture-perfect/ textbook Technical Analysis example of a market that was getting ready to transition from one of a bull to one of a bear.
Prior to that however, the key support level near $1530-$1525, which had served to bring in buyers for nearly a year and a half had to give way. All that one could say PRIOR to that level being taken out, was that the bull market was potentially changing to one of a bear but that current price action was one of consolidation/range trading.
Things changed once that $1530-$1525 level gave way as gold then entered the beginning of its current bear market. By definition, most TA students will note that a price fall of 20% or more, from off of a market peak, put a market in bear market territory. One will sometimes see these sorts of sharp falls in price, but then the market rebounds quickly and moves back above the 20% price level and resumes a range trade or even resumes a new bullish leg higher.
This was NOT the case with gold which has not regained that level ( $1530-$1525) in over a year and a half now.
Take a look at one of my favorite technical indicators illustrated below the price - namely that of the ADX and DMI. This indicator is a TRENDING indicator, one which shows the current state of the market, either trending or ranging. With the DMI added to it, it reveals which side, bull or bear, is currently in control of the price action.
Here is an important thing to note - if one goes back to the very beginning of the bull market in gold that began in late 1999 but was not confirmed until 2001, NOT ONCE over that entire period from 2001 - 2013 did the -DMI ( negative directional movement index - which indicates downward price action - ) make an upside crossover of the +DMI ( positive directional movement index). That informed us that in spite of the sharp plunge in price that occurred in 2008 as the credit crisis erupted sending a deflationary shock wave across nearly all asset classes, gold remained under the control of bullish forces. While the uptrend had been halted, the market was merely undergoing a correction and was not ready to change gears to a bear.

Now fast forward to early 2013, the same year that the gold price entered BEAR MARKET TERRITORY and also broke down below key chart support at the $1530-$1525 zone and examine the DMI lines. Do you see it? Yes, the -DMI crossed above the +DMI for the first time since falling below it back in 1999! In other words, a SELL signal was generated just as a key support level gave way on the downside.
The Bear market was thus confirmed.
Also note the Fibonacci retracement levels I have drawn in on the chart. The initial price retracement level noted, the 25% level, came in near $1507, not far off from the key zone $1535-$1525. When that gave way, the next level one looks for is the 38.2% retracement level. That was at $1287. Incidentally, that is why, in my view, the $1280 level was such a key pivot level. The market was oscillating around that number for some time.
You can see from the price action that this 38.2% level served to hold the market in a consolidation pattern for some time as prices moved above it and then fell below it but continued ranging. That has been the pattern now for the last 16 months. However, note that the TRENDLINE I have also drawn in is showing a series of LOWER HIGHS that have been occurring over this same time period.
Translation - while gold is range trading and oscillating around the 38.2% Fibonacci retracement level, the rallies are losing steam with selling coming in at progressively LOWER levels. The range trade is threatening to come to an end with the resumption of a breakout to the downside.
That is not a sign of inherent strength nor is it any indication of a market getting "ready for a moon shot higher any day now". Quite the contrary - it is a market looking more and more as if it wants to GO DOWN, not up!
This is why the "CRITICAL SUPPORT ZONE" is indeed CRITICAL at this point. If gold fails to hold here, right now, and breaks below that zone ( just like it failed to hold the $1530-$1525 zone ) odds are going to favor a move down to the 50% Fibonacci retracement level at $1091.
If that occurs, the -DMI line will cross ABOVE the ADX line for the first time since 1997! It could very well signify the start of a new leg lower in price.
I want to make it clear that I am not saying this is absolutely going to happen as I am NOT IN THE PREDICTION business which so many of the gold perma bulls seem to delight in incessantly doing ( wrongly I should add and with ZERO accountability for their failed dogmatic predictions). Traders merely note probabilities but more importantly, allow the market to speak and inform us of what it is going to do next ( even that is not 100% foolproof).
What I am saying however is that those who keep regaling us with such wisdom as "Keep Stackin", "Huge Gold Buys from Smart Money" etc, are not doing their victims any favors. How much money has been lost by those who have blindly followed their fool's counsel over the last few years? What the message from this chart is saying is the exact opposite of what those charlatans and modern day flim-flam artists are saying. It is saying "Be very careful if you are a bull" right now because the bears are in control of this market and the technical indicators are clearly showing a building bearish momentum.
Gold may well prove the bears wrong in the months ahead but that will show itself on this same price chart. For me, to get the least bit more upbeat on gold's prospects, I would need to see price clear $1400. That would tell me that something has changed in the minds of those who trade this market and that sentiment has shifted in favor of the bulls. For now, CAVEAT EMPTOR!
Based on the recent COT report through Tuesday of this week, every single category of speculator, is on the net short side of the copper market, whether it be hedge funds, other large reportables or the general public.
Swap Dealers are carrying the entirety of the net long interest in this market at the current time.
Copper prices have been grinding steadily lower due to concerns over slowing global economic growth, especially in China but got a bit of a respite today on the US GDP number, which although it was within expectations, showed some pretty good growth for Q2 2014.
Silver is showing a transition as Swap Dealers and Commercials reduce net short exposure with the former now holding a small net long position.
Large hedge funds are net short and with the metal probing lower near $17, can be expected to have upped that short position since Tuesday. Other large reportables and the general public both remain net long but both are also selling as they liquidate longs and add to new shorts.
The Goldman Sachs Commodity Index settled lower for the week but managed to recover from its worst levels at the close of trading Friday helped by strength in crude oil, the products and some of the softs as well as cattle which closed limit up.
One last thing for right now:
Look at this chart of the US Dollar. Is that impressive or what? This week makes ELEVEN CONSECUTIVE WEEKS of higher weekly closes. I will have to go back and survey the charts but surely this is one of the best performances that the greenback has shown in many years.
Looking at the chart one can see that the currency has clearly and decisively broken out above a congestion range trade that has been in plce for over 2 1/2 years now. All applicable Fibonacci retracement levels measured off the June 2010 high near 89 have been bested. Conventional Fibonacci analysis would portend a move all the way back to that peak. There does look to be some resistance coming in near the 86.50-87.00 zone prior to that however that would need to be overcome.
By all standards of TA, the Dollar is overbought and is due for some sort of setback; however, currency markets are one of the better trending markets once a solid trend is underway and thus are more prone to ignore overbought or oversold readings than other markets might be. This is because, generally speaking, the fundamental factors that go into establishing a currency trend are of much longer duration in forming and much less prone to undergoing rapid reversals.
For now, the Dollar is King once again!
Living up to their reputation for catching market participants off guard and creating fireworks, the September 2014 Quarterly Hogs and Pigs Report was released this afternoon and "boy howdy" was it a bearish doozy!
In every single category, it showed USDA's numbers far exceeding the average of analysts' estimates ahead of the reports.
Here is a copy of the report, courtesy of Dow Jones:
USDA's Average Range
estimates of estimates of estimates
All hogs and pigs on Sep 1 98 96.6 95.6- 97.5
Kept for breeding 102 101.4 99.8- 104.7
Kept for marketing 97 96.2 94.9- 97.0
Jun-Aug pig crop 99 97.6 96.4- 99.0
Jun-Aug pigs per litter 98 97.3 96.2- 98.9
Jun-Aug farrowings 101 100.4 100.0- 100.7
Sep-Nov farrowing intentions 104 103.2 102.0- 104.3
Dec-Feb farrowing intentions 104 101.5 98.2- 103.6
Hogs weighing under 50 lbs 98 97.9 96.1- 100.4
Hogs weighing 50 to 119 lbs 98 96.4 94.9- 97.7
Hogs weighing 120-179 lbs 97 94.9 94.0- 96.2
Hogs weighing 180 and over 94 93.6 90.9- 96.6
What the report shows, when you dig into it even more deeply, is the number of Pigs Per Litter moving back above the "10" level for the first time since November of last year.
That is a testament to two things:
1.) increased bio-security protocols being followed by larger scale hog producers
2.) decreased incidence of the disease during the warm, dry months of summer
Once we work through the temporary tightness in hogs that has been supporting the nearby October contract, hog numbers are going to ramp up rather rapidly. Also, extremely heavy/record hog weights will continue to mitigate any impact from the PED virus which has plagued the industry.
In comments to the wire reporters this afternoon, I noted that if these heavy weights continue, and I see no reason why there are not going to do just that, especially with cheap new crop corn coming in which is much more nutritious than the older crop stored over from last year, we should see pork production exceed the previous year's numbers for the first time in quite a while.
Another thing - with more abundant pork just ahead, end users of US pork, based on what they can now see in this report, should not be in any particular rush to load up on high-priced pork. Couple that with a soaring US Dollar and I expect export buyers to put off purchases until prices move lower.
I should also note that corn prices have fallen another $0.40/bushel since this report was tabulated. Grain (feed costs) have gotten even cheaper for producers) and that means more chances for increased profits. That will work to spur additional intentions.
While cattle have been shrugging off one negative factor after another, I think this is a bridge too far for even the cattle bulls to have to deal with. We are going to be seeing more pork and more chicken available in the Q4 and Q1 2015. Beef is pricing itself out of the demand side of the equation.
There are now TWO approved vaccines that are out there for PED virus. We are going to find out how effective these are at getting that disease under control, but if they prove to limit mortality even somewhat, the industry is going to see increased numbers as low grain prices will spur even more attempts at expansion.
Right now, based on what I can see in this report, odds favor limit down openings across the complex with perhaps the exception of the October on Monday morning. That month has been the beneficiary of a recent tightness in supply as evidenced by the 180pounds and over at 94% of last year's levels. However, the bulk of those hogs have been put down at this point.
The trade was anticipating a negative report based on the price structure of the Board but this report was so negative and exceeded the average of estimates by such a significant margin, that the initial reaction should be negative. We will have to see how things progress throughout the day however.
Do any of the readers remember not that long ago when the talk in the copper market ( and the metals market) was about those fraudulent financing deals that were being investigated in China. To refresh your memory, it appeared that the same stash of metal was being used to secure financing multiple times.
That made a big splash at the time but then seems to have been largely forgotten until overnight news surfaced that the amount involved in those less-than-upright deals was in the vicinity of $10 billon!
The metals were stored in two port cities, Qingdao and Penglai. Reports noted that potential losses for foreign banks and commodities firms could be close to $1billion. Worse however was estimates that exposure for Chinese banks could potentially be in the billions ( yes, with an "S") of dollars.
That send copper lower - as if it did not already need any help moving in that direction.
The red metal has pushed down into an important chart support zone. Failure to hold here and copper is going to change handles to a "2". It will, as it always has, take its cues from economic data.
As a way of reminder - that certain website out there, which goes by the name, "We never saw a news article that we could not interpret and spin to be bullish for gold", was pushing that story as one more perma bullish gold theory not that long ago when this thing was in the news. Talk about another one biting the dust!
Their bizarre claim was that somehow double-counted metal was bullish for gold because all of that gold that was hedged was going to have to be covered resulting in a huge rally in the yellow metal. Whoops!
By the way, gold is still holding onto its gains as the equity markets are not as of yet showing any signs of serious buying. The yen remains higher as does the bond market which is up over a full point now. Safe haven buying is definitely keeping gold aloft at the moment.
On the moo-moo front, they simply will not break down even as the beef weakens. Packer margins are already deep in the red but that is not fazing the cattle bulls. I thought that perhaps, just maybe, we might see the cattle sell off with the lower equity markets today, but no dice.
Those who think gold is volatile should try their hands at the hogs. The blasted things fell to practically limit down earlier today and then cut those losses in half as there was what might best be described as a "panic buying" short covering binge that hit the pit 15 minutes before the close of the pit. With the big Quarterly Hogs and Pigs report due out tomorrow, no one knows what to expect.
My view at this point is that regardless of what the report might or might not say, the industry is going to ramp up in a big way. It might not be reflected in that report since many hog producers have gotten wise to telling USDA their breeding plans in advance, but nonetheless, with two vaccines now approved and with dirt cheap corn prices, I expect to see significant efforts to enlarge herds. We shall see. I have been wrong on these wildly unpredictable reports before so it will not be the first time if I am.
What matters more than the report however is the reaction to it and that we will not get until next Monday morning.
One last thing- those corn/wheat spreads are coming right back on again. Amazing.
One look at the Japanese Yen is all that one needs to know that the safe haven trade was being plied today. As the stock market moved lower ( surrendering its gains from yesterday), the Yen moved higher. Bonds moved up a full point and up came gold from the grave.
This is why trading the Yen in the current environment can cause one to invest heavily in a supply of Tums or Rolaids. The infernal currency has somehow over the years morphed into a safe haven. In effect, one ends up trading risk or no risk when trading the yen.
It looked as if gold was about to run down and test $1200 as it traded below Monday's low but that safe haven buying popped it back up.
The bulls are certainly putting in a good faith effort to prevent it from breaking down and changing handles.
Very quickly on the grains... so much for the wheat rally from yesterday. Strength in the Dollar is proving to be a big lead weight for wheat.
I will try to get some more up later... it is a busy morning in trading land.