"When misguided public opinion honors what is despicable and despises what is honorable, punishes virtue and rewards vice, encourages what is harmful and discourages what is useful, applauds falsehood and smothers truth under indifference or insult, a nation turns its back on progress and can be restored only by the terrible lessons of catastrophe." … Frederic Bastiat
Evil talks about tolerance only when it’s weak. When it gains the upper hand, its vanity always requires the destruction of the good and the innocent, because the example of good and innocent lives is an ongoing witness against it. So it always has been. So it always will be. And America has no special immunity to becoming an enemy of its own founding beliefs about human freedom, human dignity, the limited power of the state, and the sovereignty of God. – Archbishop Chaput
Trader Dan's Work is NOW AVAILABLE AT WWW.TRADERDAN.NET
All that was required to launch the US Dollar higher away from strong downside chart support near the 79 level on the USDX chart was a hawkish sounding Fed. With the announcement today that they would trim another $10 billion/month off of their bond buys, interest rates shot up on the long end of the curve and with that, so did the Dollar away from support.
The rally in the Dollar, along with higher interest rates ( the latter is the big deal) resulted in a barrage of selling in gold as bulls rushed for the exits. The result was a clean break of the first level of chart support noted on the chart. The selling did not abate until gold reached the secondary support level noted.
This level had better hold or gold is going to fall back closer to $1300.
The breakdown in the ADX indicates the uptrend has been halted. I am closely watching those Directional Movement lines to see if we get a downside crossunder of the +DMI below the -DMI. So far the bulls remain in control of the market but if that support level gives way, I would expect to see it reflected in this indicator. That could very well put the bears back in control on the daily chart.
Keep in mind, based on the long term monthly chart I posted up the other day, the bears have retained control over this market but their hold was slipping. If the daily chart breaks down further, they are going to be emboldened further and a lot of those who were forced out during this recent rash of short covering, are going to come back in on the short side once again.
The jury remains out therefore. Let's see what we get. We are going to need some positive economic data to confirm the Fed's rather rosy view of the economic outlook. They are content to place a fair amount of blame for the recent poor data on the record breaking cold temps. That may be true but the warmer months are arriving and we will know very quickly whether or not that is indeed the case.
One last thing - the Euro failed to best 1.40. In my view, that will be required for gold to best $1400.
The headline title says it all - without a further escalation in the tensions over in the Crimea, gold has nothing to keep the bull fed and thus the path of least resistance is lower for now.
Longs are bailing out, especially those who bought Sunday evening up near the highs and some fresh shorts are attempting to chase them further.
The market has encountered some buying in that first zone of support I noted last evening on the charts. Here is an updated version of the same chart showing the buying zone. If the bulls cannot hold it above today's session low, then the path lower is open towards $1330 - $1325. There looks to me to be a bit of support that could show up near $1340 previous to that.
Yesterday the ADX line was flattening out indicating the potential for a halt in the recent uptrend. Today's action has actually turned it down. Bulls are still in control of the market on this shorter term chart unless gold loses $1320. That would put a big question mark into place.
Gold is therefore probing lower now as it seeks to uncover buying lurking beneath the market. The question is whether or not these buyers are willing to let it move lower before stepping in or are eager enough to hold it here and now. I honestly do not know the answer to that and thus have to wait and watch and observe.
Price will have to extend past $1390 now to run out some of the fresh shorts and to attract some more new longs. With the Fed on track for this week, price action could be volatile so hang onto your hat. If events over in the Crimea region flare up, gold will flare higher as well. STay tuned.
Pardons for the brevity and lateness of this post - it has been a busy day - again....
Gold has been reacting down since about mid-morning on Monday as word spread about the extent of the sanctions that the US was imposing to ostensibly punish Russia for its "invasion" ( US view) of the Crimea region.
I have made no secret of my view that the people of that region consider themselves as part of Russia and wished to remain that way. Why we are meddling in that matter escapes my comprehension as the turnout among the voters was spectacular and the vote was overwhelmingly lopsided in favor of that region becoming a part of the Russian Federation.
To express US displeasure the sanctions were so limited and so puny that one of the Russian ministers or deputies mocked them openly.
Gold wasted no time in properly interpreting them - much ado about nothing and promptly sold off.
Remember, a market that is being news driven especially when that news is geopolitical in nature, requires a constant barrage of bullish events or an escalation to propel it higher. Markets tend to factor in the worst possible outcome - if they get it fine - if they do not get such an outcome, they usually sell off. That is what gold is currently doing.
At this point, gold is going to require a further deterioration on the ground over there to keep driving higher. This is the reason why buying any market on geopolitical events requires one to be extremely fast and nimble on their trading. Everyone who bought the market on expectation of the worst is now in the process of taking profits while they can.
Let's see at what level the dip buyers show up again but for now, gold has failed to extend to psychological resistance at the $1400 level. It made it close but that move higher was met with plenty of profit taking by longs who realized the end of the world did not occur Sunday evening here in the West and new selling by opportunistic shorts who sold against what they believed was a $1400 ceiling.
Interestingly enough, the US Dollar still seems to have few friends. That should tend to keep gold supported on this retracement lower.There looks to me to be some resistance among Forex traders to take the Euro to 1.40 for now and that is keeping the greenback from moving lower. The currency markets are so volatile right now that trying to read where they are going next is relatively fruitless. All I can say is if the Euro can power through 1.40 then gold should respond positively and move higher. If it cannot and the Dollar remains stable, some of the "war" premium is going to be bled out of the yellow metal.

I am observing the ADX line beginning to flatten and possibly turn lower. If it does, that would signal that the current trending move higher is going to take a break. As long as the Blue Line, the +DMI, remains ABOVE the red line, the -DMI, the bulls are in control of the market and the setback in price is just that, a setback in a trending move higher. If it does not however, in conjunction with a turn lower in the ADX and a downside cross of +DMI below -DMI occurs, then I would look for some long liquidation to begin occurring. While not excessively large, we have seen a fairly decent build in long positions although I remind you that the bulk of this move higher in gold has consisted of SHORT COVERING, as I have noted repeatedly. If the shorts are done running for a while, the bulls are going to be in trouble as they are going to need to recruit some new converts to their cause quickly if they want to keep control of this market.
I have two support zones noted here...the first is the zone that was formerly resistance and extends from near $1352 to just below $1350 near $1348 or so. I would look for any dip buyers to first show up here. If they do not appear in sufficient size, then expect a drop back to stronger support centered near the $1330 region.
Let's see what we get...
At the risk of further alienating some former "friends" in the gold community, I felt the necessity to post up a long term chart of the gold price so as to provide a bigger picture perspective of how I see this market at the current time.
The gold price has a nice recovery off of the double bottom near $1180 and in the process, has improved the balances of the long suffering bulls' investment portfolios in the process. Those who failed to heed the charts on the breakdown of support at $1530-$1525 and instead listened to all the perma bulls and their various theories of why the market simply HAD TO GO HIGHER, are finally seeing a respite in the bleeding of their net worth. I am happy for them as some of them are advanced in years ( I Have read their private emails to me) and were incredibly fearful of what these paper losses meant to their retirement plans or their livelihood.
By the way, for some of you folks, I do hope you have learned the painful lesson of being 100% invested in a single sector. Under any circumstances, that is simply not wise. Too many things can occur which none of us can foresee as we are at best mere mortals.
Let's start with the monthly gold chart and with my favorite technical indicator, the Directional Movement Index. I like this one ( I use many others) because it helps me to gauge sentiment and that is what I am after as a trader.
For a bit of a refresher course - the index is comprised of three lines. Two of them are called Directional Movement Indicators. One is the Positive Directional Movement Indicator; the second is the Negative Directional Movement Indicator.
When price is moving higher or sideways, and the +DMI ( the BLUE LINE ) is above the -DMI ( the RED LINE ), the bulls are in control of the market and sentiment is bullish.
When price is moving lower or sideways, and the -DMI is above the +DMI, bears are in control of the market and sentiment is bearish.
The third line, the ADX line ( DARK PURPLE ) is the trending indicator. If it is rising, no matter if prices are going up or going down, the market is trending. If it is falling, the current trend has been interrupted and the market is either reversing course temporarily or moving sideways. Only if this line is rising is the market in a trending move.
With these few facts in mind, let's now apply this to the chart and see what we can discern.
Go back to the early inception of the decade+ long bull move in gold and look at late 1999. There, for the first time in some years, the +DMI crossed above the -DMI. The bulls had regained control of the market from the bears. However, look at the ADX line - notice is was moving lower. What does that tell you?
Answer - the downtrend that had been in place was interrupted but the market had NOT YET entered a trending move higher. All that this indicator was telling us was the bullish forces had asserted themselves with enough vigor that the bears could no longer gain any further downside traction.
It was not until 18 months or so later that the ADX began to turn higher indicating that the strong potential for a trending move was now present. A few months later, that is precisely what happened and look at what happened to the price - it moved $150 or so higher.
Here is what is important to note however and why my current view of gold is what it is - that gold is currently in a BEAR MARKET on the long term charts with the latest move higher a bear market rally. Take a look again at that +DMI line and compare it to the -DMI line. When that +DMI first crossed over the -DMI line back in 1999, it DID NOT once ever fall below that line again for a full 14 years! Please bear in mind that even with the sharp fall in price during the onset of the US credit crisis in 2008, when price imploded lower by over $300, the +DMI remained ABOVE the -DMI line. The two lines did meet but the negative crossover never occurred.
How do we interrupt this? Answer - even though the price had been whalloped, bullish sentiment remained intact. Yes, it was battered and badly bruised, but it was still there.
Do you also see what was happening to the ADX line. Over this same period, it never once ROSE DURING A PERIOD OF FALLING PRICES. What does this tell you? Answer - all moves lower in price were viewed as price retracements in an ongoing bull market. The idea of a LONG TERM BEARISH TREND did not exist.
Now, let's look at what happened in early 2013. Do you see it and do you the significance of that event? If you guessed that the -DMI crossed above the +DMI and that the bears had seized control of this market for the first time in 14 years, go to the head of the class! In other words, the bullish sentiment had been finally broken completely. Bearish forces were now in ascendency in gold.
If you also look closely, you can see for the first time that the ADX line, the trending indicator stopped moving lower during this fall in price and actually began turning higher as price moved lower. For the first time in over a decade, the potential for a trending move LOWER was in place.
That potential was aborted when the price refused to break any lower than $1180, ( not far from the industry average of the cost of production ) and the potential downtrend was halted. However, the -DMI line remained above the +DMI line revealing that bearish sentiment towards gold remained intact.
If you look at the area within the ellipse noted on the chart, you can see that the ADX is again moving lower, this time as the price moves higher. That tells me that the market has not yet resumed a bullish trend higher. What it tells us is that the market is moving sideways and while the bears remain in control, the bulls are attempting to regain control of the market. As long as the +DMI remains below -DMI, the bears, while ceding ground at the moment, still dominate.
That explains the Directional Movement Indicator and why I maintain my view that the current move higher is a rally in a longer term bear market. Based on this analysis, gold is moving sideways ( falling ADX) and is in a range trade between $1425 on the top and $1180 on the bottom. Now one may not agree with my assessment, but that is the interpretation based on my analysis of this particular indicator. Again, one can disagree with using this indicator but I am basing my view on how this same indicator has served us so adequately over the last 14 years. That is an objective interpretation and as such as it is a fact.
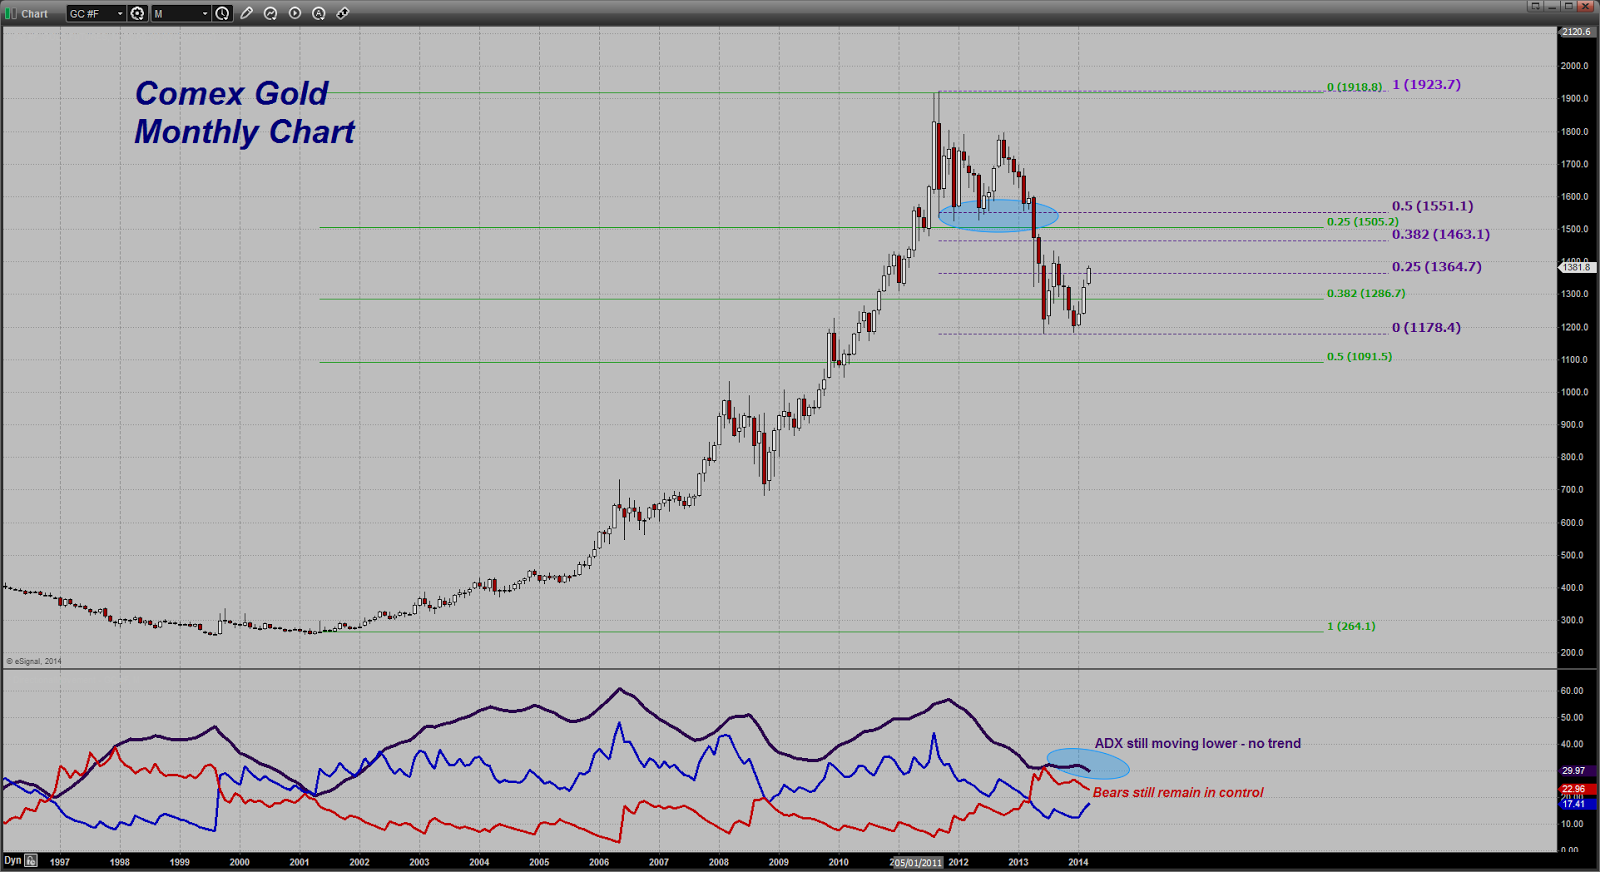
Now note the Fibonacci Retracement levels I have noted on the chart. I have drawn them ( the purple dashed lines) off the all time high above $1900 to the double bottom low at $1180. As you can see, gold has managed to claw its way above the first Fibonacci retracement level of that plunge, which is the 25% retracement currently coming in near $1365. Can you now see why there was such a battle at that region and why gold seemed to hesitate before punching through this level last week?
Notice that the next important Fibonacci retracement level does not come in until near the $1463 level ( please bear in mind that I do not use the hard number but rather look at the zone near that area). If gold can crack resistance near $1425, that looks to me to be the most viable nearer term target.
However, and this is a biggie - the 50% retracement level - the level that is most commonly noted and which carries the most significance from a technical analysis perspective, does not come in until near the $1550 region. I think it no small matter that this region is not that far removed from the critical former support level within the ellipse drawn on the chart, namely the $1525-$1530 level. Remember, it was the downside violation of that level that started a bear market in gold; therefore for gold to undergo a change from a bear market to a bull market that level MUST BE RECAPTURED by the bulls and price must stay above it.
I have no doubt that should such a thing occur, the ADX line would be moving higher and the +DMI line would be firmly above the -DMI line.
Let's take a look at one last thing and we are done - I have also drawn in another set of Fibonacci Retracement levels ( the green lines ) that mark the bottom or beginning of the bull market in gold near 250-260 and extend to the high near $1920. That is also to provide some perspective. I did not want to emphasize this set of Fibonacci retracement levels too much because I am using the ADX and the +DMI and -DMI to essentially filter my reliance on this latter set. Those are clearly bearish.
However, I have noticed over the years, that the principle of reverse polarity oftentimes extends to the use of Fibonacci levels. This means that those former levels which oftentimes mark areas of chart support or resistance, can serve as resistance on the way back if - if they served as support on the way down - or vice versa.
Note how the price fall did not fall below the 50% retracement level near $1091. It has since then moved back above the 38.2% retracement level near $1287 but remains well below the 25% retracement level at $1505.
Putting this altogether, one can see levels at which they expect opposition to gold's advance intensify should it continue to move higher. Start near $1463 and go on up to $1550 or so and you have a big zone where selling can be expected to show up in size. You can also see that if bullish forces can take out these respective levels, the bears are going to be on the defensive if their lines are shattered.
I would also think that for the metal to claw itself back up to that region, some significant events, either geopolitically or economically, are going to have occurred.
Let's see how events unfold and what we get moving forward. For now, I am done writing this weekend and need a break!
This is to provide a bit more lengthier view of the gold market action vis-a-vis the hedge fund activity going back to the beginning of 2011. It includes the rally to the record high price ( these are weekly closing prices only and thus do not reflect any intra-week spikes but only where price closed that week).
There is one thing I would really like to point out on this chart and that is the section where the words "Gold sinks to $1523 but recovers" begins. Look at the SHARP INCREASE in the number of fund long positions as opposed to the amount of short covering. Can you see it? Massive NEW BUYING in opposition to modest short covering. The number of new longs ramps up by 75,000 positions compared to a reduction of about 11,000 existing short positions. The ratio is nearly 7:1.

Then move to the right on the chart when the words, "Price hits $1525 again and then rallies to near $1800 as funds pile back on the long side and cover shorts". There we have an increase of 101,000 new longs compared to about 36,000 short positions covered. The ratio is less than 3:1 but still strongly favors new buying compared to short covering. Traders were getting excited about the possibility of gold coming back up and taking out $1800 once again and going on to make new highs but the number of skeptics was increasing.
The failure there turned the psychology around completely. Bulls bailed out in earnest and bears became aggressive. The number of longs that bailed out was about 86,000 while the number of new shorts went on to max out near 78,000. Clearly it was a huge change in sentiment that caused this.
What I would like to emphasize is the fact that during times when the bullish psychology was still at work in gold, rallies back off of support levels that were tested and held were led by a huge number of new long positions in comparison to the number of short positions being covered. That was reflective of the bullish sentiment that was still intact even after the big drops in price. Traders were convinced that the bull market was going to resume and did not want to miss it, after it had been ongoing for a decade.
When the price failed on the third test of $1800 the sentiment began to shift and even the most resolute of bulls began to waver. The final blow came when $1530-$1525 gave way and down she went.
This time around we are watching gold rally but the move higher is being led by a greater number of shorts compared to the number of fresh new long positions. That is what has me concerned. A careful analysis shows that there is no longer the same resolute bullish sentiment that once existed prior to the breakdown at $1800 but especially after the failure at $1530-$1525.
That is why, even though we have had a nice move off the lows, we are still not seeing bulls getting aggressive. I am convinced that we will need to see at least a breach of $1425 and a change in the handle to stay at "14" before we will get some skeptics on the sidelines to come in. Gold needs to see a change in sentiment for a brand new bullish trend higher can be maintained.
Please bear in mind that I am talking about a strong new uptrend and the resumption of a bull market. Until $1530 gets recaptured, this is just a rally in a bear market. It is a nice rally, and is certainly a tradeable rally, but it is nonetheless a bear market rally.
There needs to be further developments, whether geopolitically but more importantly concerning the US Dollar to occur before we will once again see the strong NEW BUYING that has in the past been a hallmark of bullish moves higher than have some sticking power.
Again, that certain website and its plagiarizers over there - I am watching you.... You may use this chart and the accompanying notes but I expect full credit to be prominently noted.
It took a bit of doing but I have been able to create a chart of the price of gold overlaid against the activity of the big hedge funds based on the Commitment of Traders report.
I present it here for your reading convenience. The blue line is the number of OUTRIGHT LONG positions among this group of traders. The black line is the number of OUTRIGHT SHORT positions. The area chart ( in green) is based on the CLOSING PRICE of gold for the week ( please note that this is not a daily chart).
Notice the near perfect symmetry of the green area chart ( the gold price at the Comex) with the blue line. This is why I keep stating that the big speculators ( hedge funds) are the drivers of our modern markets. You can see the price of gold has tended to rise and fall with that blue line until early in 2013.
About that time, the number of short positions by the hedge funds because to increase as this category of traders became increasingly bearish. The wholesale long liquidation halted at that time as well. From that point forward, the blue line is relatively flat.
However the gold price continued to fall. Why was that? Answer - because the hedge funds began to play gold more from the short side as they ramped up the number of outright short positions to its largest point in over a decade. That selling took the price of gold down below $1200 at one point ( remember this is a weekly closing price).
In July of 2013 an enormous short covering rally took the price of gold up over $200 from off the low. Can you see the sharp fall in the BLACK LINE and the corresponding rise in the green area?
Then look at what happened - the price of gold began to fall again but this time around it was mainly due to hedge fund long liquidation ( see the sharp drop in the blue line). Shorts were covering into that long liquidation and that is why the black line moved lower along side of the gold price.
Then in November of last year, the hedge funds began aggressively shorting gold again ( the black line rises sharply) with the result that the price dropped well over $150 into the end of the year.
Now look at what has happened this year... look at that black line and see it plummet. Look also at the blue line and see it jump. Hedge funds are both covering shorts aggressively while some in that same category are rebuilding longs. The result has been to push the gold price up nearly $200 once again.
Please note that this has everything to do with money flows ( money flowing into and out of gold) and nothing to do with price manipulation theories. When specs are buying, the price rises. It does not matter whether the buying is coming from short covering or from new buying - the price will rise.( The longevity of that price rise is however dependent on the nature of that buying - but that is a different topic ).
When specs are selling, the price will fall.
What you see reflected in these two lines, the black one and the blue one, is a visual graph of INVESTOR SENTIMENT towards gold. It really is that simple. Tell me what the sentiment is towards gold, and I will tell you what the price is going to do. Why do you think we spend so much time attempting to discern the shifts in sentiment and what is driving prices?
Notice I am using the words "INVESTOR SENTIMENT". By that I mean Western investment demand, not Asian physical buying. The latter merely bottoms the gold price; it does not drive it strongly higher. That is reserved for investment demand coming from the West.
Incidentally, this is what technical analysis and study of the charts does for us - it provides a glimpse into changing sentiment. Learn to read the charts, and you will learn to gauge sentiment. You do not need to waste your money and enrich others by paying for their high-priced newsletters and putting up with their wild predictions. In my mind, too many of these hucksters cannot make a living trading so they rely on you, their carbon-based, warm-blooded hosts, to feed them and provide them with a stream of steady income. Save your money, force these human ticks to trade to earn their own living, and do your own analysis and your own thinking.
I can tell you one thing with absolute certainty - if the majority of these overpriced newsletter hustlers had to actually trade to produce an income, you would see a huge reduction in the number of wild prognostications, sensational claims, goofball theories ( backwardation claptrap always comes to my mind), and other assorted reasons for you to rush blindly into a market without having the foggiest idea of why you are putting YOUR HARD-EARNED WEALTH at risk based on the theory of someone else whom you do not know and who will still make money even if they are wrong. You, on the other hand, are the one who stands to lose. Remember that....
This story simply will not die as it keep happening - hedge funds continue to cover short positions to an extent far surpassing the amount of fresh, new buying that they are doing.
Last week they covered ( closed out) 4,675 short positions. This week they outdid themselves as they covered a whopping 5,248 shorts made up of both futures and option positions! On the long side, they actually reduced their exposure by some 482 contracts. It is too bad that we cannot see what occurred from Wednesday through Friday. My view is that today's strong rally through overhead chart resistance further cleaned out some more of their short positions in a big way.
Let's again put this in perspective - at the start of this year, the hedgies were sitting with a total of 72,571 outright short positions, futures and options combined. As of this past Tuesday, that number has shrunk to a mere 21,073 or a reduction of 51,498 shorts.
Over this same period, the number of outright longs has increased from 106,675 to its current number of 144,080, for an increase of 37,405 futures and options positions.
Again, the clear driver for gold this year has thus far been short covering as the dominant feature among the biggest specs on the planet.
My own personal view is that the hedge funds seem to be reluctant to get too aggressive on gold from the long side. Perhaps some do not trust a rally predicated on a geopolitical event. Either way, in looking at the chart, I am of the view that it will take a push through that spike high near $1425 to get them to really commit in size to the gold market. That is a big level to watch, if we can get there.
What I mean by that is where we need to see some critical chart resistance level give way in a very convincingly manner to convince the doubters and skeptics to come on into the water and get completely wet. There are still many who are content just dipping their toes in. Translation - we need to see far more new, fresh buying outnumbering the number of shorts getting squeezed out.
You must have more than short covering to SUSTAIN A STRONG BULLISH TREND. As I have said before, all good bull moves begin with short covering but, and it is important to note and understand this, they cannot sustain themselves solely on buying by frustrated or nervous bears; they must have fresh blood.
There is an old saying among we traders - "A bull market requires fresh food every day to feed it". By that I mean one needs to give NEW REASONS for longs to get aggressive and remain brimming with confidence over their existing positions to where they are eager to add on and pyramid up. Short covering does not result in that. That merely provides a burst of fuel that drives the price higher but then fizzles out, sometimes as fast as it began. One has to see sustained waves of buying continue to come into a market to KEEP if defying gravity.
By the way, that certain web site that loves to plagiarize what it finds here, please note that we are watching you so if this shows up on your web site or any of your publications, without attribution to the source, it will be duly noted.
Here is a chart only of hedge fund activity at the Comex gold market. Look at that plunge in short positions. That is what happens when a geopolitical events catches some traders off guard. The damage inflicted can and will occur very quickly and without much, if any, warning, leaving a mad scramble to exit existing positions.
I find it very interesting to also note that once again, this week, these same hedge funds were busy plowing into the SHORT SIDE of the copper market in large size. They piled on 4,618 new shorts while simultaneously dumping 3,288 existing longs. They are now NET SHORT copper to the tune of nearly 10,500 contracts.
As was the same case as with last week, every major category of traders is NET SHORT in copper, with the exception of the Swap Dealers who are holding the entirety of the long side in this market. The small traders, the general public, are also short.
Copper managed to close a bit higher today but after plunging a massive $0.18/lb this week, a bit of a profit taking bounce to head into the weekend is not unexpected.
I therefore find it no coincidence that this week was marked by strong selling in the hedge fund community of the Silver market. A total of 1,939 new shorts were added while 414 longs were dumped. They are still net long the market but have evidently been more inclined to follow copper this week rather than gold. Silver, as always can never seem to quite make up its mind what kind of metal it wants to be on any given day, an industrial metal or a precious metal. Just flip a coin as you can pick either one with about as much success as you can in predicting mountain weather.
We have the market setups - now we wait to see how events in the Crimea will unfold over the weekend. Based on the late-in-the-day price action in gold and in the US equity markets, there remains a great deal of nervousness around.
In what has been a constant theme for this past week, conditions on the ground over in the Ukraine region have generated nervous safe-haven related buying in the gold market. With equities looking a bit wobbly, some investors are selling stocks and buying gold ( the reverse of what they had been doing for all of last year). Throw on top of the fact that the Dollar continues to be losing friends of late, and the path of least resistance for the yellow metal has been higher.
The strong finish to close out the week puts the market on really firm footing as we head into next week. The wild card, and the potential to be a big spoiler, is this weekend's referendum in the Crimea. If the votes goes as many expect ( with the region voting to become a part of the Russian Federation) and all hell does NOT break loose, there is a very good chance that gold will see a fairly substantial amount of selling come the reopening of trading Sunday evening here in the US ( Monday morning in Asia).
Geopolitical events, by their very nature, are incredibly volatile. As such, both buying and selling tied to these sorts of things is completely emotion driven. That means the losing side acts first and thinks later. All they know is that they are on the wrong side of a trade and their account balance is disappearing. So out they run. Volume tends to run quite high during such times.
What this means is very simple - you have a 50/50 chance of getting it right as a trader when dealing with geopolitical events. I personally will NEVER trade those odds. Why not just hit the casino and roll the dice because that is about the same set of odds. Traders deal with favorable probabilities based on technical analysis. If you want to test your luck, try picking up some out of the money put or call options depending on your perspective and roll the dice on those. At least you know what the extent of your losses is going in while leaving the upside open for some good profits if you happen to hit it right.
I do wonder however with all the hype about massed troops on the border, Western sanctions, deadlines, etc. whether or not the gold market has already factored in most of those expectations. If things disappoint in the sense that WWIII does not break loose, I would expect to see the selling show up. If the conditions worsen, then gold will move higher as it factors in another and more dangerous scenario.
That is how markets work. They anticipate events ( that is why it is called a "FUTURES" market and not a PAST or a PRESENT market. If the events materialize within expectations, more often than not you get a case of "Buy the Rumor; Sell the Fact". If the events do not unfold as expected, then the reactions can be quite severe, either up or down depending on the particular turn of events and how it is being interpreted by players.
What I can say is that traders of both persuasions when it comes to gold ( bull or bear) had better have some very light and very fast trigger fingers come Sunday evening. They might just need them.
Here is the weekly chart for gold. This week's performance was a real doozy of a show put on by the bulls. I have included the note I put on this same chart earlier this week which stated that if they could close the week over the resistance zone noted, ( $1,350 - $1,355) they have a real shot at reaching psychological resistance at the $1,400 level. They did just that!
Again, the move has been predicated on fear/concerns over that situation in Ukraine ahead of this weekend's big vote so just be prepared because all of this could evaporate if the world does not end come Sunday evening. The obvious flip side - If tensions remain high, so too will the gold price remain supported.
Looking at the technical levels on the chart you can see a couple of things here - the first is that the ADX line is beginning to flatten out. That is suggesting that the sideways action ( on an intermediate term basis the market has merely been moving in a sideways range between $1180-1200 on the bottom and $1425 or so on the top) could be coming to an end and that the POTENTIAL ( please note the use of the word) exists for this broad consolidation pattern to be coming to an end being replaced by a trending move higher.
That spike high near and around the $1,425 level would need to be taken out to shift this particular indicator that I favor into a trending mode. If it were to do so, one could easily make the technical case that a move back up to retest the broken FORMERLY MAJOR SUPPORT near $1,525 is reachable.
The Dollar's action would of course be key to this as well for if it cannot stay above 79 on the USDX chart, I do not believe gold will fail at the $1425 level. Any weakness in the Dollar of that nature would send a lot of strong speculative inflows into gold and those should be enough to better that spike high.
Again, let's see how events unfold over the weekend.


