"When misguided public opinion honors what is despicable and despises what is honorable, punishes virtue and rewards vice, encourages what is harmful and discourages what is useful, applauds falsehood and smothers truth under indifference or insult, a nation turns its back on progress and can be restored only by the terrible lessons of catastrophe." … Frederic Bastiat
Evil talks about tolerance only when it’s weak. When it gains the upper hand, its vanity always requires the destruction of the good and the innocent, because the example of good and innocent lives is an ongoing witness against it. So it always has been. So it always will be. And America has no special immunity to becoming an enemy of its own founding beliefs about human freedom, human dignity, the limited power of the state, and the sovereignty of God. – Archbishop Chaput
Trader Dan's Work is NOW AVAILABLE AT WWW.TRADERDAN.NET
Barclays, in one of their research notes today, named Goldcorp as one of their top picks for 2014. They cited an expected increase in gold production of some 33% by the end of the year 2015. This is the result of heavy cap-ex in 2013 to bring these various projects to a state of production. They expect that spending will drop considerably in 2014 while gold output increases. The study also cited an expected cost of production at $888/ounce compared to the industry average of $959/ounce.
GG is up some 3.4% as I type these comments. The HUI is actually doing better as it is up some 4.2%.
It is refreshing to finally see some notes like this hitting the beleaguered mining sector. Value-based buying could very well put a bottom in the mining sector. If, and this is a big "IF", the shares stop moving lower, gold, the metal, will not be far behind. I would keep an eye on the reported holdings of the gold ETF, GLD, to see if that bleeding finally has been stemmed and the reported holdings begint to rise. That would be a clue that the worst is over.
Again, the jury is still out on this in my view but the chart action looks encouraging for a change. Even Barrick gapped higher today and is currently up over 5% on the day! It opened sharply higher on a strong gap and then pushed through the 20 day moving average. That is the first time it has been above this level since October 30th!
Note that the ADX has turned lower from a rather lofty level indicating a pause or interruption in the ongoing downtrend. The market could move into a consolidation pattern at these levels with value based buyers perhaps cementing the recent lows just above $15 as a higher secondary bottom from the low made this summer. The stock could conceivably move up to as high as $21.00 or so and still be in a broader range trade. If it were to climb past that level, on decent volume, it would confirm a long term bottom is in.
Barrick's lousy performance has been a type of proxy for the entire sector as a whole so if this stock were to turn and begin a leg higher, the rest of the sector will more than likely go along for the ride as well. Don't forget that just because a stock stops going down does not mean it is going to immediately start a sustained move higher. It could conceivably meander sideways for some time before a catalyst of some sort kicks it up and out of a range trade.
The intermediate term Weekly chart still shows the bears in control of this stock so try not to get too slap happy. Remain objective ( if you can) but enjoy the respite from the selling barrage.
Lots of fireworks occurring in the grains today on the heels of a major USDA report. Currently all of the grains ( I am including beans in this category) are lower even though the numbers for corn and soybeans were initially considered supportive.
USDA lowered US stockpiles for both corn and beans based mainly on an expected increase in exports due to the lower prices we have been experiencing especially compared to last year. However, they did raise total global bean production, mainly due to an increase in Argentinian production. My reading of this report informs me that there is certainly not going to be any acute shortage of soybeans around. Usage has been strong however and that is keeping a floor beneath the market.
Expectations for beans heading into the report were for a reduction in the ending stocks; however, the number was within expectations and prices moved lower on a "buy the rumor; sell the fact" scenario.
Wheat stockpiles are growing. USDA raised the ending number by 10 million bushels above expectations catching some in the trade by surprise.
Overall the report seems to me to have taken the starch out of the recent move higher in corn and bean prices. It will take some further bullish demand news or some bullish supply side news to kick prices into any further strong rallies.
As many of you who regularly read this blog are aware, I keep a close eye on the grain markets, as well as the livestock markets, to try to get a sense of the overall direction of food prices.
Another thing I am taking away from this report - look for used farm equipment prices to get a bit of a shot in the arm from this data. The big banner money years that farmers had been seeing over the last few year years are over for a while. Corn prices are trading about 50% below their record price and while prices for both corn and beans are still good, they are no where near those historic highs. Maybe some good will come out of this in the sense that the hedge funds can stop buying up farm land in the Corn Belt and prices can bet back to more sane levels.
Or better yet - look out for Klingon and Romulan cloaking devices....
This is a fascinating read...
Chinese scientists upbeat on development of invisibility cloak
http://www.scmp.com/news/china/article/1376652/chinese-scientists-upbeat-development-invisibility-cloak
And some wonder why American students falling behind the rest of the world in science is so hugely important....
We are experiencing a nice upmove in gold in today's session which is also being participated in by silver.
There are a couple of things at work today. First, after expectations that the Fed was going to announce a tapering at next week's FOMC meeting, traders have now largely dialed that back.
Secondly, and more importantly, this is contributing to further US Dollar weakness. We saw that yesterday but it is more notable in today's session as the USDX slid under the 80 level.
The Dollar has been recently been trapped in a range trade of its own. The top comes in between 81.40 - 81.00 while the bottom of the range is 79.20 - 79.05. As the Dollar has pushed higher in this range, gold has pushed lower. Now that the Dollar is breaking lower and moving back towards the bottom of the range, gold is powering higher.
In the case of gold, its upward progress has been exaggerated due to the build in hedge fund short positions which are vulnerable anytime one of these overhead chart resistance levels can be violated. That brings on another wave of strong short covering, which coupled with bottom picking, results in some sharp moves higher.
It should also be pointed out that we are now at that time of the year when some traders are going to begin squaring books for the end of the year. Shorting gold has been a fantastically profitable trade for 2013 and many shorts will look at the recent price action and decide to actually book those profits before they slip away.
Remember the old adage in trading: Bulls make money; Bears make money but Pigs get slaughtered.
In looking at the chart there are two things to note. The first is that HUGE VOLUME that I have noted on the chart when gold went back down and RETESTED the recent low of $1210 on that payrolls number. As mentioned in a post that day, the price action caught my attention as it portended a possible exhaustion day of the bearish leg lower. Gold however was unable to extend past the initial resistance level noted on the chart which would have confirmed that $1210 region as a double bottom on the chart. It did so today however and that needs to be respected.
I have made some annotations on the price chart. Today's move higher does open the door to a move up towards what will be stubborn selling resistance near $1290 - $1295. Bulls will want to see gold maintain these strong early-session gains however as the day wears on to give the market a realistic shot at such a scenario.
If this move is for real, we will not want to see the rally being losing steam as the day drags on. That would indicate that the short covering burst is failing to attract FRESH NEW BUYING.
Also helping gold is the fact that the HUI has managed to recapture the 200 level.
I am noticing that interest rates are moving lower once again as traders dial back expectations on the timing of any tapering. That is why the Dollar is seeing selling pressure and why gold is moving higher as a result. Recent action in interest rates reveal that rising rates on the long end of the curve have tended to bring selling into gold. In the absence of any widespread inflation fears, traders have tended to see this as a reason to sell gold.
We'll keep monitoring price action and see if we can decipher what the market is thinking.
In response to some private emails, I wanted to post up a chart detailing why, in spite of the massive amount of money created through the Federal Reserve's Quantitative Easing, there simply does not seem to be a massive wave of inflation building here in the US. Some may be wondering why I tend to focus on this thing termed, "Velocity of Money" but in my view, even though at times it may seem to delve into the realm of the esoteric, nothing can be more important in determining the future direction of the gold price.
Many will recall that when the first QE program was instituted ( late 2008) commodity prices and stock prices both bottomed out. The view of the majority of investors/traders was that the creation of such enormous sums of money through bond buying and mortgage backed security buying was going to result in a sharp jump in inflation. Almost as if on cue, commodity prices began to rocket higher as hedge funds jumped in on the long side of that asset class.
As the initial QE I began to near expiration, the Fed announced round 2 and thus QE II was born. More commodity buying ensued with gold soaring higher, eventually reaching a peak above $1900.
A strange thing began to happen however after QE II wound down - after that was replaced by QE III, Operation Twist, and then QE IV, gold continued to move lower along with most of the rest of the commodity complex. The US equity markets continued to ascend however.
I am not an economist nor do I make any such pretense of so being. What I am is a trader and traders have to notice when markets no longer respond in the manner to which one expects or assumes that they will respond.
Something had changed and for whatever the reason ( we can leave that to those who are more sophisticated about such matters ) a general wave of deflationary pressures surfaced in the commodity complex. I maintain that most of the "money" being created by the QE programs has not and continues to NOT make its way into the broader economy. It has gone primarily into the hands of speculative forces which have directed into equities. In other words, while these QE programs have not resulted in the widespread outbreak of inflation that most market participants originally expected them to produce during rounds I and II, one thing I think we can say with absolute certainty, is they have indeed produced a MASSIVE WAVE OF INFLATION in the US EQUITY MARKETS.
Such huge sums of "money"/ liquidity cannot be conjured into existence WITHOUT SOME CONSEQUENCES SOMEWHERE. To believe otherwise is to suspend all economic common sense and logic.
Let me interject one note here when it comes to general commodity prices. Many who read this site have seen me use ( to the point of disabuse ) the phrase, " the best cure for high prices is high prices". What is meant by this is that high prices encourage those entities engaged in the creation/manufacture/production/growth of the various commodities that are rising in price to INCREASE their production in order to maximize their profits as they take advantage of this increase in the price.
This is capitalism at its finest - the market gives the signal and the industry responds to the signal. As the supply then increases due, it eventually overwhelms the demand at that level and price then falls to balance the new increase in supply with the current level of demand.
During the run up in commodity prices during QE I and QE II, producers/growers, etc. responded to the higher prices by ramping up the supply. As there is always a lag time between the rise in price and the subsequent increase in supply, we are now seeing that. One can merely look at the corn and soybean markets as an example. I had quipped to some newswire writers and some friends that these extreme prices for both of these commodities was going to send growers in both S. America and here in N. America down to their local Home Depot/Lowes to buy clay pots and other assorted window boxes so as to have even more space/"land" to plant these crops. Lo and behold, we put in a record corn crop this year and an extremely large bean crop. Ditto for S. America.
So now we have two forces that have been working against any rises in commodity prices ( in general ). The increase in supply resulting from higher prices a couple of years ago combined with an outflow of speculative money in SEARCH OF YIELD in this NEAR-ZERO interest rate environment.
This has been a bit of a digression from my main point here but I felt it was important enough to note this. Here is that chart again:
Note how in spite of the QE programs, this key indicator, has continued to fall. Again, not being an economist I cannot get into all the when, where's and why's about this indicator but suffice it to say, my understanding of the inflation phenomenon, in the sense of sharp jumps in inflation, requires that money be changing hands in the general economy at an INCREASING RATE. That is clearly not happening.
What is rather startling is that this indicator has fallen to its lowest level since this data set was collected. That was over 50 years ago!
Look closely at the last grey area on the chart indicating a recession. Can you see how the Velocity of Money plummeted during the onset and into the depth of the credit crisis that erupted in 2008? Then look at the brief blip higher on the right edge of that grey region. Velocity of Money shot up rather sharply when QE I was announced. However it did not last in that uptrend for long. The graph peaked in the second half of 2010 and has been moving lower ever since.
Here is a closer look:
Here is a chart of gold:
It continued moving higher for nearly a year after the Velocity of Money turned lower. Some of this is the result of the sharp fall in the US Dollar that began at precisely the same time that the Velocity of Money chart peaked.
Here is a chart of the US Dollar index peaking at the same time VoM turned lower:
We then had the outbreak of the European Sovereign Debt crisis which triggered another huge round of gold buying but once that crisis was "contained" ( not solved ) there was nothing left to support gold based on the "inflation is inevitable" prognosis as the Velocity of Money continued moving lower.
Note how gold turned lower after the ECB took actions to stem the bleeding in the European sovereign debt market:
It seems to me that gold is now basically mirroring the Velocity of Money at this point. Outbreaks of confidence-rattling episodes have brought buying into the metal, but once that issue(s) is(are) resolved, or better, removed from the forefront of trader/investor's minds, the path of least resistance takes over and gold heads downwards once again.
This now brings me full circle to why I believe any sort of SUSTAINED RALLY in the price of gold will not occur until either CONFIDENCE in the ability of the monetary masters is shattered or rattled, or INFLATION EXPECTATIONS begin to arise. The latter is tied directly to the Velocity of Money in my opinion. When/if we see that indicator turn higher, gold prices should respond. I do want to note however that it will be important to also watch the bond/interest rate market to confirm market sentiment in that regards.
As always, we can posit a theory but until the market confirms it and sentiment shifts in that direction, a theory is simply that, a theory, or better, an opinion.
This chart is in response to a query from a reader....
The intermediate term shows the bears still in control of this issue. The downtrend was interrupted in late July. Since then ABX has been moving in a sideways or consolidation pattern. Price remains well below the key 50 week moving average.
The ADX is beginning to turn higher indicating the possibility that this stock could be resuming its bearish trend lower. Bulls cannot allow the price to fall below the July low or further losses will be seen.
If the bulls can take price past $22.50, they will regain control of the stock.
Here are some gold charts once again to take a look at where things stand in that market.
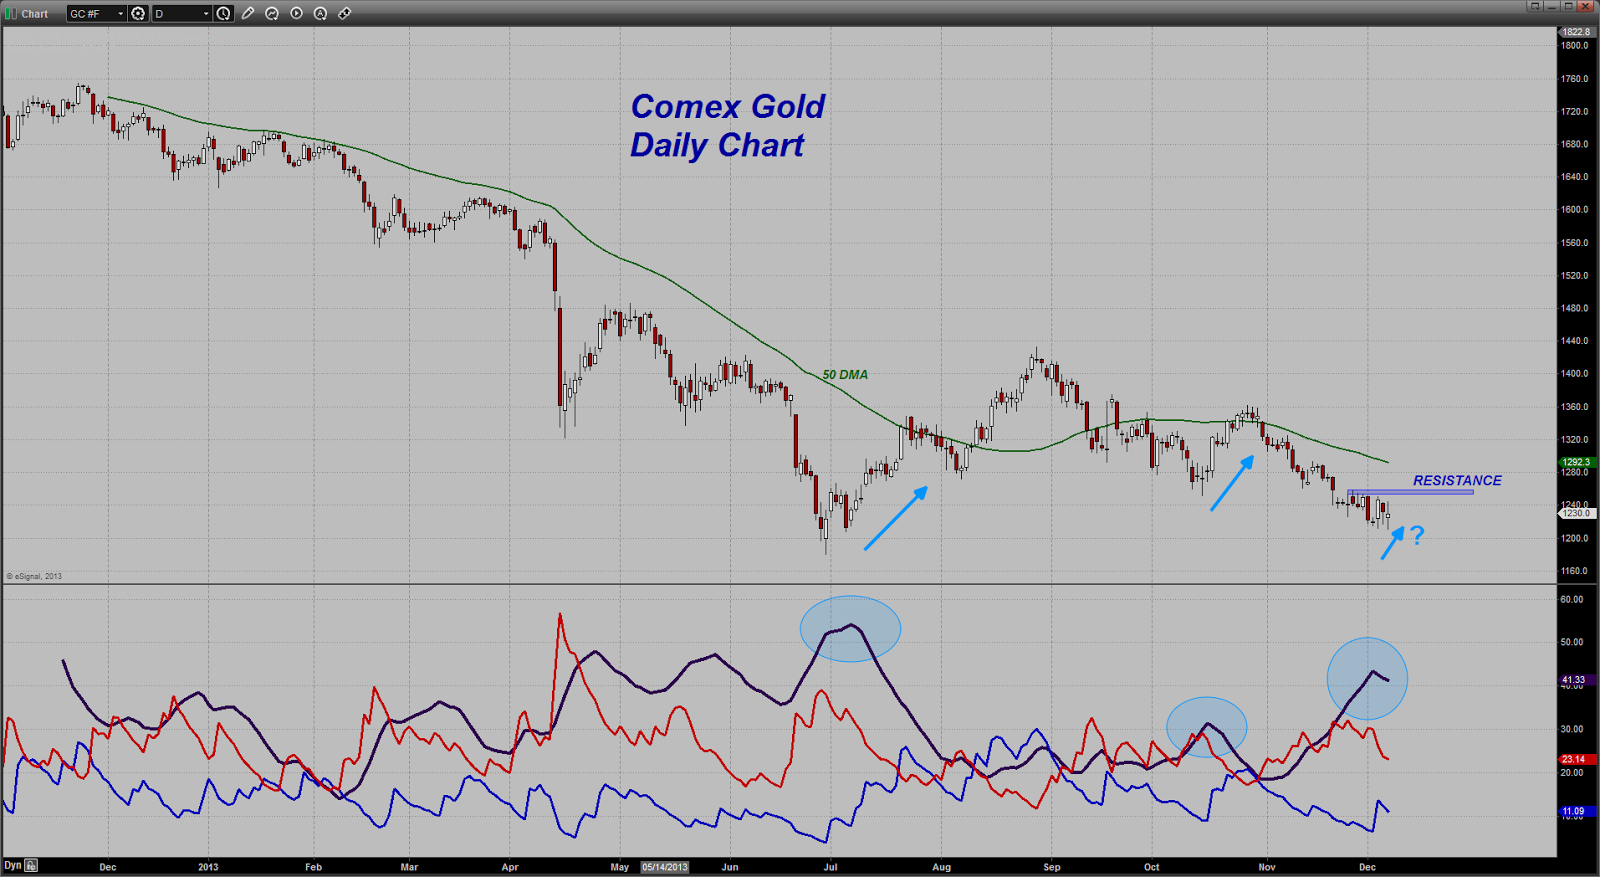
Let's start with the Daily....
Note I am only using the ADX on these charts as I am trying to discern a TREND change.
The first thing to notice is that the ADX line has now turned down from a high level (above 43). That tells us that the downtrend has been temporarily halted. I have noted previous downturns in the ADX by ellipses. Note that the market has experienced some upward moves in price that followed such events. Therefore, the POSSIBILITY exists that we could see a relief rally in gold.
In my view, this will only occur IF the bulls can take price through the overhead resistance line I have noted. If that were to occur, you could see enough short covering to take the price up towards the 50 moving average which is currently moving lower ( the trend has been down) and which comes in near the $1292 level.
While the ADX has turned down indicating that the current leg lower has stalled out, the Negative Directional Indicator ( Red Line ) remains above the Positive Directional Indicator ( Blue Line) indicating that the Bears are still in control of this market on the daily time frame. I do not see any bullish divergences among those indicators at this time.
Let's shift now to the Weekly Chart...
Can you see the difference in the ADX line on this time frame? While it did turn down late in July indicating the disruption of the intermediate term downtrend, it HAS NOT TURNED DOWN at this time. Actually it is NOW RISING. Translation - on this intermediate time frame, the downtrend in gold appears to be resuming. That is in stark contrast to the daily chart.
Keep this in mind - all trend changes will FIRST be detected on the Daily Chart. Later action will then determine whether or not such a trend change is occurring as well on the intermediate or Weekly Chart or whether this is just another move higher in an ongoing bear market. One really has no way of knowing this at this stage. Only viewing subsequent price action can determine this. It is important to note however that the longer the time frame used, the more important the trend. What this means is that the onus is on the bulls to prove that control of the market by the bears is in jeopardy.
Note that the Negative Directional Movement Indicator ( Red Line ) is firmly above the Positive Directional Movement Indicator ( Blue Line ). The Bears are firmly in charge on the intermediate time frame.
Generally speaking, rallies in gold will thus be sold until proven otherwise.
Please click on the following link to listen in to my regular audio interview with Eric King over at the KWN Metals Wrap.
http://www.kingworldnews.com/kingworldnews/Broadcast/Entries/2013/12/7_KWN_Weekly_Metals_Wrap.html