To all;
Thanks for the comments and feedback on the recent article entitled "Deciphering Silver". Glad it was helpful.
To the skeptics - I would suggest you look far more closely at the comparison chart of silver and the CCI. It is evident you fail to understand just how hedge funds treat the risk on/risk off trades.
When the CCI moves lower, silver will GENERALLY move lower along with it. When the CCI moved higher, silver generally moved higher along with it, especially since September of last year when the chart pattern between the two has been almost identical.
The charts simply do not lie but it has been my experience that those with closed minds will never be convinced no matter what illustrations are shown them. For one to continue blaming Morgan for the downdraft in silver even as the CCI has been plummeting suggests that somehow MOrgan is responsible for taking the entirety of the commodity complex lower. Never mind the fact that hedge fund short positions are going up as the commodity sector goes lower -
By the way, have you noticed that the CCI is moving strongly higher today and SURPRISE, so too is silver.
Some of us old time traders well remember the link that used to be between silver and soybean prices. Typically when soybeans were moving higher in a weather market, silver would move higher as well. Guess what - Soybeans are in a full fledged weather market as the drought pattern worsens over the MidWest and the entire grain complex is soaring with new crop corn locked at the limit up price.
It sounds weird, but we traders back then would draw a connection between rising grain prices and inflationary pressures and would oftentimes buy silver as a result. Looks like the old link might still be there, even though the equity markets are moving lower today and there is some light strength in the US Dollar.
If grain prices start a strong trending move higher and begin gathering more upward momentum, it is going to impact the general price of food moving foward and that will be inflationary from a supply standpoint. The big question is what will happen to the demand side of the equation if high grain prices begin choking off demand, particularly in a rotten global economy. The battle royale between the macro picture and the various fundamentals across the commodity markets continues.
Hold on to your hats!
Monday, June 25, 2012

Sunday, June 24, 2012
Deciphering Silver
The internet has been awash with comments recently about the downdraft in silver and the strong increase in Open Interest on last week's big down day. As usual, the chatter is about an orchestrated attempt by JP Morgan to smash the price of silver lower so that they can cover their "losing short position".
Let me first state that I am a firm believer in the view that the US government has a vested interest in controlling the price of gold. Being a good friend of GATA, we both have ridden through the ups and down of this together for the last decade. However, that being said, not every move lower, particularly in the Silver market, is the result of efforts by Morgan.
Part of the problem that some of the authors have, authors whom I might add see every single move lower in silver the result of price capping by Morgan, is that they do not understand how traders, particularly large traders, react to changes in sentiment and how they will adopt defensive strategies to cushion themselves against further losses until they can better sort out what they want to do next. These would do well to understand the nature of spreads and the ability to use spreads as part of a strategy to cushion against losses while in a defensive posture.
Take a look at the following chart of the CCI, the Continuous Commodity Index, versus the price of Silver. I mentioned not all that long ago, that silver was not going to go anywhere until the chart of the CCI turned solidly bullish. Why? Because Silver, for all of its history as a monetary metal in many places around the globe, is still regarded by large hedge funds and other large investors, as a RISK ASSET; one that performs strongly during periods in which INFLATION is the main concern.

Look at the solid black line which is the CCI. Notice how it has been moving relentlessly lower ever since it topped out near 700 back in April 2011. Now look at the solid red line, which is the closing price of silver. It topped out that same month near $50 and has been headed relentlessly lower also. Why? Because traders increasingly became convinced that the global economy was slowing, being impacted by woes out of Europe as well as near stagnant conditions across the US and elsewhere.
As a matter of fact, the chart patterns between the two, are very similar and have been almost identical since September of last year.
Now take a look at the following chart detailing the Commitments of Traders report.


If we draw out the chart a bit longer, it becomes quite insightful. Notice back to the summer of 2008 when the credit crisis first erupted. The outright short position of the hedge funds is now even larger than it was at that point.
 If you combine this with the fact that even as hedge funds are LIQUIDATING long positions in silver there is at the same time, some funds in this category whom are now building SHORT positions, it does not take much market understanding to realize why the price of silver is moving lower. It DOES NOT TAKE JP MORGAN 'smashing silver' to knock the price of silver lower. If anything MORGAN is using this hedge fund activity to actually cover their NOT LOSING short positions as some of these commentators keep telling us, but their EXTREMELY PROFITABLE SHORT POSITIONS.
For the sake of time I am not going to put up a chart of the Commitment of Traders of Copper, but suffice it to say, that hedge funds have begun building short copper positions in there this year also. Note the Copper peaked in February of this year, the exact same month as Silver peaked. Was JP Morgan "smashing copper lower to cover their losing short bets"? The answer is obvious - of course they were not - the hedge funds are taking copper lower just as they have been taking silver lower. Why? Because Copper is also viewed primarily as a RISK ASSET, just like silver, and a harbinger of the rate of growth expected in the global economy.

Silver has been finding good buying near and just above the $26 level from some big players. This buying has been of sufficient size that it has been able to absorb this speculative type selling originating not from Morgan, but from the hedge fund community in general. As long as these buyers continue to see this level as a good VALUE, silver will hold. If they pull back for any reason, hedge fund selling is going to take this market lower. It will not be Morgan that does it.
The conclusion to all of this is simple - as long as the environment persists in which traders are more concerned about slowing global growth and/or deflationary pressures, both silver and copper for that matter, will find it difficult to mount any sort of sustained upside activity. Note that I said, "Sustained". That means that we can and will get occasional upside moves higher when sentiment temporarily shifts and traders expect Central Bank actions to be of sufficient size and scope to counter the deflationary forces building in the global economy or economic data looks positive in some instances. But until we get something that occurs that will ACTUALLY produce a more lasting impact in that regards, hedge funds will be selling rallies.
Once again, the ball is firmly in the court of the Central Banks.
Let me first state that I am a firm believer in the view that the US government has a vested interest in controlling the price of gold. Being a good friend of GATA, we both have ridden through the ups and down of this together for the last decade. However, that being said, not every move lower, particularly in the Silver market, is the result of efforts by Morgan.
Part of the problem that some of the authors have, authors whom I might add see every single move lower in silver the result of price capping by Morgan, is that they do not understand how traders, particularly large traders, react to changes in sentiment and how they will adopt defensive strategies to cushion themselves against further losses until they can better sort out what they want to do next. These would do well to understand the nature of spreads and the ability to use spreads as part of a strategy to cushion against losses while in a defensive posture.
Take a look at the following chart of the CCI, the Continuous Commodity Index, versus the price of Silver. I mentioned not all that long ago, that silver was not going to go anywhere until the chart of the CCI turned solidly bullish. Why? Because Silver, for all of its history as a monetary metal in many places around the globe, is still regarded by large hedge funds and other large investors, as a RISK ASSET; one that performs strongly during periods in which INFLATION is the main concern.
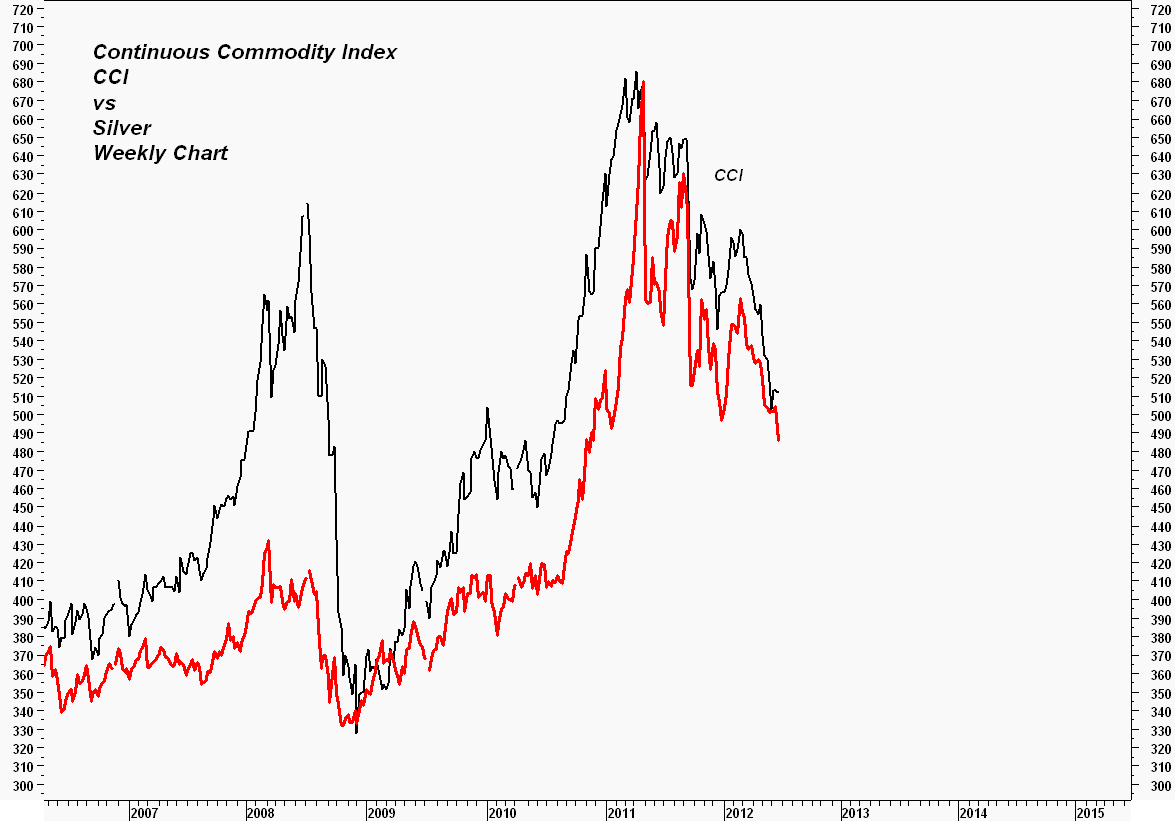
Look at the solid black line which is the CCI. Notice how it has been moving relentlessly lower ever since it topped out near 700 back in April 2011. Now look at the solid red line, which is the closing price of silver. It topped out that same month near $50 and has been headed relentlessly lower also. Why? Because traders increasingly became convinced that the global economy was slowing, being impacted by woes out of Europe as well as near stagnant conditions across the US and elsewhere.
As a matter of fact, the chart patterns between the two, are very similar and have been almost identical since September of last year.
Now take a look at the following chart detailing the Commitments of Traders report.

I have noted the various categories of traders on the Legend below the chart. Look particularly at the blue line in the positive section of the graph. It is important to note here that this is the NET LONG position of the hedge funds. Note how it peaked and then turned lower in September of last year, then moved solidly lower until the beginning of the year when it began to turn higher once again. What was that all about? Once silver peaked near $50 the sentiment shifted across the entire commodity complex and soured all the way into the end of last year. Then, at the beginning of this year, traders began to expect action in the Euro Zone from the ECB with some help from the Fed. They thus started to rebuild long side exposure to the entire commodity complex. That buying drove silver prices $10 higher to start the first two months of this year pushing it to near $37.50 in February. That was it - from then on, it has moved steadily lower on a monthly basis tracking the CCI nearly tick for tick.
What does not show up on this above graph however, is the actual NAKED SHORT POSITION of this same category of traders. For that, take a look at the following graphic. Can you see what is taking place? Hedge funds are building short side exposure to silver. I have only included the last 18 months worth of data but as you see, a mere month ago and this category of traders has been as bearish as they have been in a good while.


For the sake of time I am not going to put up a chart of the Commitment of Traders of Copper, but suffice it to say, that hedge funds have begun building short copper positions in there this year also. Note the Copper peaked in February of this year, the exact same month as Silver peaked. Was JP Morgan "smashing copper lower to cover their losing short bets"? The answer is obvious - of course they were not - the hedge funds are taking copper lower just as they have been taking silver lower. Why? Because Copper is also viewed primarily as a RISK ASSET, just like silver, and a harbinger of the rate of growth expected in the global economy.

Silver has been finding good buying near and just above the $26 level from some big players. This buying has been of sufficient size that it has been able to absorb this speculative type selling originating not from Morgan, but from the hedge fund community in general. As long as these buyers continue to see this level as a good VALUE, silver will hold. If they pull back for any reason, hedge fund selling is going to take this market lower. It will not be Morgan that does it.
The conclusion to all of this is simple - as long as the environment persists in which traders are more concerned about slowing global growth and/or deflationary pressures, both silver and copper for that matter, will find it difficult to mount any sort of sustained upside activity. Note that I said, "Sustained". That means that we can and will get occasional upside moves higher when sentiment temporarily shifts and traders expect Central Bank actions to be of sufficient size and scope to counter the deflationary forces building in the global economy or economic data looks positive in some instances. But until we get something that occurs that will ACTUALLY produce a more lasting impact in that regards, hedge funds will be selling rallies.
Once again, the ball is firmly in the court of the Central Banks.
Saturday, June 23, 2012
Gold Chart and Comments
Gold did not have a good week ending down $61 or 3.7% from the prior week's closing print. As we all know by now, disappointment by bulls who had bought out ahead of the FOMC meeting and statement, was quickly reflected in the initial drop lower when the statement hit the wires. However, during that same day, there was a reconsideration after parsing the statement and the price rebounded taking back most of the losses. After further reflection overnight, the sentiment once again soured and down it went plunging through $1600 in the process and closing near the low of the week and the session.
Quite frankly, until traders become convinced that some sort of policy move by Central Bank Planners which will stem the downward economic spiral is forthcoming, they are not going to buy. It will be up to the big physical market buyers, mainly the Asian Central Banks, who are valued based buyers, to put a floor under the gold market.
Many keep pointing to the amount of money that has already been injected into the system in expectation that inflation issues are mere moments away. Unfortunately, if that were the case, we would already be seeing soaring commodity prices and of course a soaring gold price. The problem is that the rate at which this money is turning over or changing hands in the economy, the VELOCITY OF MONEY, continues to plummet.
Notice the following chart detailing the VELOCITY OF MONEY. I have charted the simplest measure of money supply (M1) as well as the more complex measure (MZM). No matter which one we take, VELOCITY is trending lower. What this means is that while the Fed has been busy injecting liquidity into the system, it really is not going anywhere (besides into the US equity markets by the Big Banks). The result is that while the FUEL FOR INFLATION is in place, the WIND TO FAN THE FLAMES is currently missing. People and business are simply not spending money at a fast enough pace to fan the fires of inflation.


Quite frankly, until traders become convinced that some sort of policy move by Central Bank Planners which will stem the downward economic spiral is forthcoming, they are not going to buy. It will be up to the big physical market buyers, mainly the Asian Central Banks, who are valued based buyers, to put a floor under the gold market.
Many keep pointing to the amount of money that has already been injected into the system in expectation that inflation issues are mere moments away. Unfortunately, if that were the case, we would already be seeing soaring commodity prices and of course a soaring gold price. The problem is that the rate at which this money is turning over or changing hands in the economy, the VELOCITY OF MONEY, continues to plummet.
Notice the following chart detailing the VELOCITY OF MONEY. I have charted the simplest measure of money supply (M1) as well as the more complex measure (MZM). No matter which one we take, VELOCITY is trending lower. What this means is that while the Fed has been busy injecting liquidity into the system, it really is not going anywhere (besides into the US equity markets by the Big Banks). The result is that while the FUEL FOR INFLATION is in place, the WIND TO FAN THE FLAMES is currently missing. People and business are simply not spending money at a fast enough pace to fan the fires of inflation.

Let's zoom in a bit closer to see some more detail. Notice that it was not until the first round of QE1 was underway in early 2009 that VELOCITY began to increase. It had collapsed as the credit crisis erupted in the middle of 2008 and the Fed came charging in to arrest that ominous trend. Of course it was no coincidence to see gold rally from a low of 680 prior to the first round of QE all the way to near $1250 during the same time period that the slope of the Velocity line turned higher.

Gold continued to rally higher even despite the fact that the graph turned lower as traders still believed that the total sum of near $2.5 TRILLION in combined QE would set the stage for soaring inflationary issues. Commodity prices roared higher and the US Dollar sank lower. After all, we were talking about an unprecedented amount of money creation. Alas, it was all to no avail as the issues with the enormous amounts of indebtedness swallowed it all up with woes out of Europe further complicating issues.
From where I stand, it seems to me that if the Fed is eventually going to launch another round of stimulus, not that it will accomplish anything of LASTING significance, it is not going to have any desired impact unless it is of sufficient size that it turns this VELOCITY chart higher. It seems that the law of diminishing returns may well be at work with the market dismissing any QE package that is not at least as large as the prior ones and that means a minimum size of $900 billion as was QE2 ($600 billion in Treasuries and $300 billion in Agency debt).
Quite frankly, it would be downright terrifying if the Fed were to announce a new round of QE of say, $500 billion, and the markets, after an initial knee jerk response higher, were to sell off. Imagine the size that would then be needed. Perhaps this is one of the reasons that they are reluctant at this point to pull the trigger on the next round of QE. Maybe they are fearful of the reaction if the markets are disappointed? Then what would they do - buy stocks directly??? Personally I keep waiting for them to cut a check to every individual taxpayer. Now that is my kind of stimulus! For that matter, why not just cancel the income tax altogether - after all, who need revenue when you are spending yourself into oblivion anyway.
One last chart - that of gold itself - it has been rejected from the resistance level near $1620 - $1625 shown on the chart. That level was the bottom of the former consolidation range. It is now moving lower again down towards the bottom of its NEW congestion zone with $1550 - $1525 on the bottom. This is the zone into which Asian Central Bank buying has been very strong in the past. Hopefully this will continue.
This sort of value-based buying is what carves out floors in markets. However, to see strong uptrending moves, particularly in gold, we are going to need to see a sentiment shift in the minds of traders away from fearing slowing global growth and deflationary pressures towards one of fearing rising prices and inflationary pressures. That is going to require some sort of catalyst. What form that takes and when exactly it occurs is unclear but considering the amount of liquidity that has been injected into the system, when the VELOCITY chart does indeed change, it will be no mean or small event when it does!

Trader Dan on King World News Markets and Metals Wrap
Please click on the following link to listen in to my weekly radio interview with Eric King on the KWN Markets and Metals Wrap.
Friday, June 22, 2012
HUI Chart Pattern Needs Some Help
As has been the case with the mining shares for some time, (going back as far as the first round of QE in late 2008), they require a shift in trader sentiment away from a DEFLATIONARY scenario towards one of INFLATION. The latter is what has resulted from each round of stimulus launched by the Federal Reserve.
This week's lack of an imminent launch of a QE3, has set mining shares, as well as bullion, back on their heels as traders have made the shift back towards expecting a further slowdown in global growth and more of a deflationary environment.
This shift is showing up in the decidedly bearish chart pattern now forming in the HUI once again.
If you take a look at the Fibonacci Retracement Levels noted as well as the horizontal support and resistance levels I have marked on this chart, you can see just how closely both correspond with the other.

In the middle of May, price rebounded sharply from the decline that began in late February as the gold shares reached levels of valuation that many believed were excessively low. That brought in some very strong buying which took price to near the 460 mark, a level which happens to be both the bottom of a former consolidation range and the exact HALFWAY or 50% Fibonacci Retracement Level of the entire decline.
Price then retreated as expected with dip buyers coming back in and taking the index back up to 460 once again. This time however, instead of continuing to power higher, the index fell back sharply when the lack of QE3 hit traders between the eyes.
The index failed to hold support near the 440 level, a level which formerly had been resistance on the way up and now became support on the way down. It also corresponded to exactly the 38.2% Fibonacci Retracement Level of that same decline that began in late February.
Technical Analysis's REVERSE POLARITY PRINCIPLE tells us that it should have held if the market were going to continue with a bullish posture. Its failure to do so is therefore bearish for the short term.
The index will now probe lower as it seeks to uncover buying support once again. There looks to be the potential for that support to have emerged near 420 but it is too early to say so with an certainty. Confirmation will only occur if the price moves back ABOVE 442 and holds.
If not, the path of least resistance on this index is lower with the level near 410 the next region where some buying should emerge. Failure to hold there and the index faces the real possibility of heading down towards first 390 and then the recent low near 370.
The onus is firmly on the back of the bulls to perform.
This week's lack of an imminent launch of a QE3, has set mining shares, as well as bullion, back on their heels as traders have made the shift back towards expecting a further slowdown in global growth and more of a deflationary environment.
This shift is showing up in the decidedly bearish chart pattern now forming in the HUI once again.
If you take a look at the Fibonacci Retracement Levels noted as well as the horizontal support and resistance levels I have marked on this chart, you can see just how closely both correspond with the other.

In the middle of May, price rebounded sharply from the decline that began in late February as the gold shares reached levels of valuation that many believed were excessively low. That brought in some very strong buying which took price to near the 460 mark, a level which happens to be both the bottom of a former consolidation range and the exact HALFWAY or 50% Fibonacci Retracement Level of the entire decline.
Price then retreated as expected with dip buyers coming back in and taking the index back up to 460 once again. This time however, instead of continuing to power higher, the index fell back sharply when the lack of QE3 hit traders between the eyes.
The index failed to hold support near the 440 level, a level which formerly had been resistance on the way up and now became support on the way down. It also corresponded to exactly the 38.2% Fibonacci Retracement Level of that same decline that began in late February.
Technical Analysis's REVERSE POLARITY PRINCIPLE tells us that it should have held if the market were going to continue with a bullish posture. Its failure to do so is therefore bearish for the short term.
The index will now probe lower as it seeks to uncover buying support once again. There looks to be the potential for that support to have emerged near 420 but it is too early to say so with an certainty. Confirmation will only occur if the price moves back ABOVE 442 and holds.
If not, the path of least resistance on this index is lower with the level near 410 the next region where some buying should emerge. Failure to hold there and the index faces the real possibility of heading down towards first 390 and then the recent low near 370.
The onus is firmly on the back of the bulls to perform.
Thursday, June 21, 2012
Gold Bulls React to FOMC Statement after Overnight Reflections
What a difference one day can apparently make in the minds of traders! Yesterday, following an initial sharp downside knee jerk reaction to the lack of an imminent QE3, Gold (and Silver) both rebounded well off their lows as traders became convinced that the Fed had surely left the door open to a round of QE should there be one more month of disappointing payrolls numbers.
That sentiment sure proved fleeting, not only in the precious metals markets, but across the entire spectrum of commodities, as well as the bond markets.
Die-hard equity bulls, who were consoling themselves that if they did not get their dearly beloved and eagerly anticipated round of drugs yesterday, would surely get it from their dope-dealing masters at the Fed soon, were throwing away everything that they had purchased yesterday at a big, fat, whopping loss. As mentioned in my piece on King World News, the equity markets DIED a long time ago as far as being any source of efficient allocation of precious capital. The entire structure is now being GAMED. Instead of XBOX or NINTENDO, (the younger kids and early adult are playing those), we have GAMERS trying to time the Fed and any other official monetary sector authorities. INVESTING is DEAD. What lives is who is fastest on the power key combination of their "ENTER" button to slam orders down the wires into the exchanges.
Whoops, another stumbling block - numbers out of China this AM reinforced the slowing global economy theme. Then, as if that were not enough, the Philly Fed readings confirmed more of the same. Further piling on were former Fed Chairman Alan Greenspan's comments that the economy was "very sluggish".
Bonds took back most of yesterday's losses with the yield on the Ten Year dropping back down towards the 1.6 level.
In short, DEFLATION was the theme of today's session as traders simply do not see any source of inflationary pressures without another quick round of liquidity injections, compliments of the Fed. That means that they are going to be selling commodities. Just take a look at crude oil which is imploding as it has now broken down through the bottom of chart support.


Gold has failed to break through the shorter term downtrending line noted on the chart that formed within the recent congestion zone. It has also failed to sustain its footing above psychological support at $1600. It now looks as it it is going to be up to the Eastern Central Banks to rescue the metal from hedge fund computer algorithms as it moves back down to its solid support zone noted on the chart.

That sentiment sure proved fleeting, not only in the precious metals markets, but across the entire spectrum of commodities, as well as the bond markets.
Die-hard equity bulls, who were consoling themselves that if they did not get their dearly beloved and eagerly anticipated round of drugs yesterday, would surely get it from their dope-dealing masters at the Fed soon, were throwing away everything that they had purchased yesterday at a big, fat, whopping loss. As mentioned in my piece on King World News, the equity markets DIED a long time ago as far as being any source of efficient allocation of precious capital. The entire structure is now being GAMED. Instead of XBOX or NINTENDO, (the younger kids and early adult are playing those), we have GAMERS trying to time the Fed and any other official monetary sector authorities. INVESTING is DEAD. What lives is who is fastest on the power key combination of their "ENTER" button to slam orders down the wires into the exchanges.
Whoops, another stumbling block - numbers out of China this AM reinforced the slowing global economy theme. Then, as if that were not enough, the Philly Fed readings confirmed more of the same. Further piling on were former Fed Chairman Alan Greenspan's comments that the economy was "very sluggish".
Bonds took back most of yesterday's losses with the yield on the Ten Year dropping back down towards the 1.6 level.
In short, DEFLATION was the theme of today's session as traders simply do not see any source of inflationary pressures without another quick round of liquidity injections, compliments of the Fed. That means that they are going to be selling commodities. Just take a look at crude oil which is imploding as it has now broken down through the bottom of chart support.

Silver is in serious trouble based on its technical chart. It MUST HOLD ABOVE THE RED SUPPORT LEVEL SHOWN or it is heading to $24.50 or even lower to $24 unless the bulls perform immediately. As you can see, going all the way back to September of last year, every time the metal has come down towards $26, it has not stayed there long. Buyers have always shown up. THose buyers had better be here.

The HUI Has further reinforced the 460 level as that level which MUST BE TAKEN OUT if the shares are going to sustain any sort of upward trending move. They are currently sitting right on the next level of chart support. If the buyers do not show up later today and tomorrow, there is a good chance that we will see the index drop to the next red line further down.

Gold has failed to break through the shorter term downtrending line noted on the chart that formed within the recent congestion zone. It has also failed to sustain its footing above psychological support at $1600. It now looks as it it is going to be up to the Eastern Central Banks to rescue the metal from hedge fund computer algorithms as it moves back down to its solid support zone noted on the chart.

Monday, June 18, 2012
Gold Stocks Recover from Late Friday Afternoon Mauling
AS many of you no doubt are aware, there appeared to have been some sort of coordinated bear raid on many of the smaller gold companies late Friday afternoon, particularly in the aftermarket hours when trading conditions are at their absolute thinnest.
The entire sector however is getting a firm bid in today's session even with the metals initially lower. Their strength seems to be pulling both gold and silver higher.
The HUI is closing in on very stubborn chart resistance in the 460 region. This region marked the bottom of a consolidation period back in March of this year and is now serving as a line for sellers to short against. If the leaders in the sector can manage to attract additional buying going into tomorrow's session, it should drag the entire index right back up towards 460 once again.
IF, and this is a big "IF", the bulls can force enough of these hedge fund shorts to cover and in the process take the index through 460 and keep it above this level, we should see additional short covering and fresh buying emerge to take the index all the way to the top of that same former consolidation range. That region lies near 480. That will be the next big test.

The entire sector however is getting a firm bid in today's session even with the metals initially lower. Their strength seems to be pulling both gold and silver higher.
The HUI is closing in on very stubborn chart resistance in the 460 region. This region marked the bottom of a consolidation period back in March of this year and is now serving as a line for sellers to short against. If the leaders in the sector can manage to attract additional buying going into tomorrow's session, it should drag the entire index right back up towards 460 once again.
IF, and this is a big "IF", the bulls can force enough of these hedge fund shorts to cover and in the process take the index through 460 and keep it above this level, we should see additional short covering and fresh buying emerge to take the index all the way to the top of that same former consolidation range. That region lies near 480. That will be the next big test.

Saturday, June 16, 2012
Dollar Bulls Leaning Heavily on the Long Side of the Boat
Bullish bets on the US Dollar have reached at least a 7 year high as the crisis in the Euro Zone and the slowing global economy has sent money flows careening wildly into the Greenback.
As you look at the Commitment of Traders chart shown below, you can see that this LONG DOLLAR trade is extremely crowded. Markets in this condition, while they can most certainly continue heading higher, are very unstable and quite susceptible to violent downside action should a technical trigger force a bout of long liquidation.
Friday, we got a bit of a hint as to what might happen to the Dollar should sentiment shift. It was hit rather hard heading into the weekend ahead of the crucial Greece vote as traders began reacting to the possibility of coordinated Central Bank activity early next week. The eager buyers from Monday and Tuesday all ended up as panicky sellers with the market completely erasing its gains early in the week.
Note that the selling did stop at the 38.2% Fibonacci Retracement Level of the rally that began in May.

If, and this is a BIG "IF", the Central Banks do indeed announce a coordinated liquidity infusion, this massive speculative long position may very well be vulnerable. While certainly the problems afflicting the Euro Zone are not going to be cured by any such Central Bank action, traders will, at least for the short term, view such action as lessening the need for a safe haven. That is when things could get interesting to say the least. I would expect an initial drop down to the 50% retracement level where the mettle of the bulls will be tested.
Longer term, one can still make the case that as soon as further problems begin flaring up over in the Euro Zone, the Dollar will head higher once again but keep in mind, today's markets are dominated by computer algorithms and if those things say "SELL" in regards to the Dollar based on any downside support levels being violated, there is an ENORMOUS amount of longs who are going to get their heads handed to them.
As you look at the Commitment of Traders chart shown below, you can see that this LONG DOLLAR trade is extremely crowded. Markets in this condition, while they can most certainly continue heading higher, are very unstable and quite susceptible to violent downside action should a technical trigger force a bout of long liquidation.
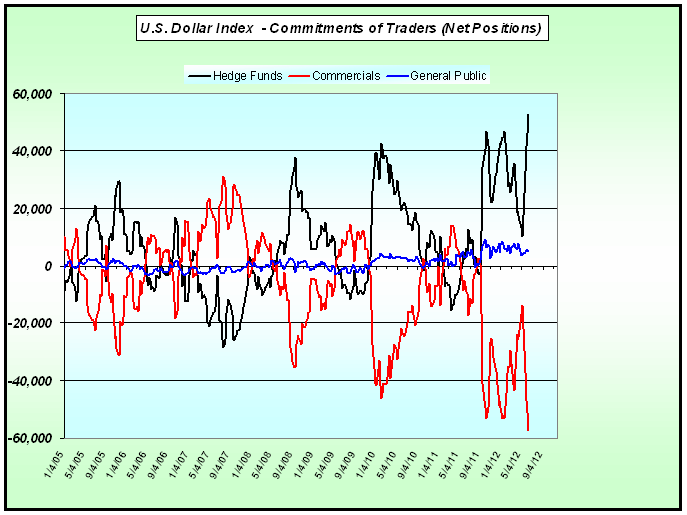
Friday, we got a bit of a hint as to what might happen to the Dollar should sentiment shift. It was hit rather hard heading into the weekend ahead of the crucial Greece vote as traders began reacting to the possibility of coordinated Central Bank activity early next week. The eager buyers from Monday and Tuesday all ended up as panicky sellers with the market completely erasing its gains early in the week.
Note that the selling did stop at the 38.2% Fibonacci Retracement Level of the rally that began in May.

If, and this is a BIG "IF", the Central Banks do indeed announce a coordinated liquidity infusion, this massive speculative long position may very well be vulnerable. While certainly the problems afflicting the Euro Zone are not going to be cured by any such Central Bank action, traders will, at least for the short term, view such action as lessening the need for a safe haven. That is when things could get interesting to say the least. I would expect an initial drop down to the 50% retracement level where the mettle of the bulls will be tested.
Longer term, one can still make the case that as soon as further problems begin flaring up over in the Euro Zone, the Dollar will head higher once again but keep in mind, today's markets are dominated by computer algorithms and if those things say "SELL" in regards to the Dollar based on any downside support levels being violated, there is an ENORMOUS amount of longs who are going to get their heads handed to them.
Subscribe to:
Posts (Atom)