
Tuesday, February 28, 2012
HUI still stuck below resistance
Gold and silver mining shares are moving higher today, especially silver shares, but the HUI is still lagging from a technical analysis perspective. It just cannot seem to clear this stubborn level near the 555-560 region.
If you note on the chart, this band of horizontal resistance also corresponds exactly with the downside gap that opened up in early December of last year. This gap is currently serving as a barrier for further upside progress.
We will have to watch to see whether bulls in mining shares are feeling confident enough to try to mark these things up agains the hedge fund ratio spread traders. One would have expected a better performance in these seriously undervalued shares especially with silver's sharp rally through resistance at $35.50 and gold's ability to remain above $1780. So far, nothing doing.

All Boats Rising?
Take a look at the following set of charts and see if it leaves you as confused as I am.
First the broader stock market as indicated by the S&P 500:

Now comes the commodity complex as illustrated by the Continuous Commodity Index:

Lastly comes a chart of the US long bond:

The rising stock market is supposedly the outcome of an improving economy, or so we are assured by all the experts. The economic recovery is evidently proceeding "so well" that the S&P 500 just made a brand new 52 week high in today's session and is now amazingly back at the exact same level it was prior to falling off a cliff in the summer that the 2008 credit crisis erupted. I guess we can all relax now since obviously the entire fallout from that fiasco is now behind us... or is it?

I am being sarcastic here since what we are seeing is the effects of liquidity splashing all over the entire US economy. It is that factor that is sending hot money into not only the equity markets but also the commodity markets and is pushing up the cost of tangibles once again. Rest assured that once these hedge fund money flows begin intensifying even further into the commodity sector (wholesale prices), we are going to all see this passed through on the retail side of the equation.
This is perhaps the reason that the bond market is not going in the opposite direction of the stock market. If the economic recovery were in fact actually as strong as the price action in the S&P 500 is signifying, the bond market would have already dropped below the bottom of its trading range and would have begun a strong downtrend portending a rising interest rate environment. It is not doing that.
This tells us that the bond market does not buy into all the hoopla surrounding the rising price of equities and is not anticipating anything remotely resembling a period of strong economic growth ahead of us in the immediate future. While one would think that rising commodity prices would be viewed as evidence that inflationary pressures are slowly building from the Fed's near-ZERO interest rate policy, bonds seem to have made up their mind that these rising prices, particularly energy prices, are going to act as a DRAG on the economy moving forward.
Until we see a breakout to the downside in the bond market, all the talk of an improving economy is just that - TALK. When I see long term interest rates beginning to rise steadily, then I will believe it. Until then, it is just the inevitable result of issuing enormous amounts of liquidity in an environment conducive to nothing more than WILD-EYED hedge fund speculation.
Monday, February 27, 2012
Gold encountering resistance near $1780
Based on what we have seen in the price action the last few trading sessions, gold is having some difficulty convincingly clearing the level near $1780. That has now formed as a technical chart level that will need to be taken out to set up the potential for a thrust to the $1800 mark. If the bulls can do that, the level near $1820-$1825 comes into play.
Downside support still remains untested near the $1750 level. You will recall that it was this level that kept the price from moving higher on the way up after gold stalled out there on several tests.
I will feel extremely confident that this market is going to move higher as long as we hold above $1725-$1720 on any possible move back towards those levels.
This market has had a sharp move off the lows near $1535 that was nearly unimpeded all the way to $1750. It then consolidated for nearly two weeks working in a range of some $60 or so over that time period. The sharp spike higher through chart resistance $1780 signalled the end of that particular range trade. It could be that the metal wants to base here a bit and gather another load of stem before moving higher. We'll see what we get in the next couple of trading sessions.

Silver looks to me like it was capped below major chart resistance at the $35.50 level on the continuous chart. Obviously the perma-bears know well the significance of that level. Shorts are digging in there and it will be up to the hedgies to dislodge them if they are to make this thing run to $39.

Saturday, February 25, 2012
Strong weekly close in Gold
Gold was able to close the week out on a very strong note, although some traders did decide to cash in some profits ahead of the weekend, after getting a nice run of some $65 off of last week's close as of Thursday's peak price. Even in spite of the light round of profit taking, gold still managed to put in a very solid WEEKLY close surrendering only about $15 off its best level of the week and closing within striking range of $1800, the top of the heavy resistance zone noted on the price chart.


For a bit of a longer-term perspective, I am including a monthly chart of the metal. Note carefully the clearly defined uptrending channel that can be seen going back into the bottom in gold in late 2008, when the Quantitative Easing programs were first announced. Gold has tracked within this channel very closely with the brief one month exception when it got a bit overheated and frothy later last year. That sharp parabolic rise was met with selling that corrected the overbought reading and took price back within the channel.
Here is the significant point to make -this month's price action has thus far taken the price to the top of this channel once again. I think it is no coincidence that we did see some selling therefore arise late Thursday and into Friday's session particularly as gold approached the $1800 level which just so happens to be very close to the top of this channel. It is both a logical and a technical chart selling point.

If, and this is a big "IF", the metal pushes through the top of this channel and closes the month above it, odds would then favor an acceleration of the trend higher and perhaps a new and steeper uptrending price channel being formed. I would especially want to see a second consecutive monthly close ABOVE this old channel coming at the end of March to confirm this however to avoid another one month wonder.
If we were to get that, I do not think it would be very long before we revisit the all time highs above $1900.
What this would be telling us fundamentally is that gold is now convinced beyond all shadow of a doubt that the near world-wide currency debauchment by the Central Banks is not going unnoticed.
That environment, which is simply another way of stating NEAR-ZERO interest rate policy, is generating genuine fears of currency debasement and the subsequent strong inflationary impact that inevitably arises from such a policy.
We would also get a confirmation by a strongly rising Continuous Commodity Index.
Take a look at the weekly chart shown below for an intermediate term view of the market. Note how the chart resistance near the $1800 level can clearly be seen. Gold did not challenge this level this week but from a technical standpoint, it does stand a very good chance of so doing next week.
If you notice the pattern I have marked as a "bullish pennant" or a "bullish flag" you will see the flagpole and the pennant or actual flag. These patterns occur often enough that they should be noted as they generally portend a strong move in the direction of the flagpole which can be used as a gauge of where price might be expected to run in the near future. The length of this flagpole which extends from the bottom near $1535 to the top of the pole coming in near 1765 is $230.

Once you get a brief period of consolidation, which is exactly what we have had the last three weeks prior to this one just completed, a fresh upside move which takes out the HIGH OF THE FLAGPOLE then gives us the potential for a move of some $230 higher. Some technicians will add this to the top of the flagpole giving a projection of $1995. Others whom are a bit more conservative (put me in that category) will add the length of the flagpole to the BREAKOUT POINT of the downtrending line forming the top of the flag. That price point came in near $1725 which yields a projection of $1955. Either way it gives us gold at a brand new all time high.
An ideal technical price action will be, in the event of any subsequent price reaction lower, to see gold find buying coming in along the line that marks the top of the flag which then causes the price to rebound and begin moving higher. It is just another way of demonstrating that buyers are eager to buy dips and see value at this new, higher level. They are not willing to risk sitting on the sidelines in the hope of purchasing the metal even lower. If you do break below the bottom of the flag itself, the formation will generally be void although that does not mean that price has peaked. It merely means that the bullish flag formation projection is not going to be reliable.
For a bit of a longer-term perspective, I am including a monthly chart of the metal. Note carefully the clearly defined uptrending channel that can be seen going back into the bottom in gold in late 2008, when the Quantitative Easing programs were first announced. Gold has tracked within this channel very closely with the brief one month exception when it got a bit overheated and frothy later last year. That sharp parabolic rise was met with selling that corrected the overbought reading and took price back within the channel.
Here is the significant point to make -this month's price action has thus far taken the price to the top of this channel once again. I think it is no coincidence that we did see some selling therefore arise late Thursday and into Friday's session particularly as gold approached the $1800 level which just so happens to be very close to the top of this channel. It is both a logical and a technical chart selling point.

If, and this is a big "IF", the metal pushes through the top of this channel and closes the month above it, odds would then favor an acceleration of the trend higher and perhaps a new and steeper uptrending price channel being formed. I would especially want to see a second consecutive monthly close ABOVE this old channel coming at the end of March to confirm this however to avoid another one month wonder.
If we were to get that, I do not think it would be very long before we revisit the all time highs above $1900.
What this would be telling us fundamentally is that gold is now convinced beyond all shadow of a doubt that the near world-wide currency debauchment by the Central Banks is not going unnoticed.
That environment, which is simply another way of stating NEAR-ZERO interest rate policy, is generating genuine fears of currency debasement and the subsequent strong inflationary impact that inevitably arises from such a policy.
We would also get a confirmation by a strongly rising Continuous Commodity Index.
Trader Dan on King World News Weekly Metals Wrap
Please click on the following link to listen in to my regular weekly radio interview with Eric King on the KWN Weekly Metals Wrap.
http://tinyurl.com/6ov65yp
http://tinyurl.com/6ov65yp
Friday, February 24, 2012
Gasoline nearing an important Inflection Point
The following chart is a weekly graph of the price of unleaded gasoline showing some lines that detail areas where both resistance and support can be identified.
As you can clearly see, the price has rallied some 70 cents snce the end of last year without hardly a pause. It is currently closing in on a very important chart inflection point which is just shy of the $3.20 level. Based strictly on technical analysis and nothing fundamental, if this market pushes past that point (notice it is knocking right on the door of the lower line of the pitchfork - which is where it can be expected to encounter selling pressure), then not only will it have bested upsloping resistance but it will also have taken out horizontal resistance coming in near that level as well.

By the way, Newt Gingrich has an outstanding presentation at his website for bringing down gasoline prices, permanently, and for sharply reducing American dependence on imported oil. Check it out.
http://www.newt.org/news/newt-2012-announces-first-air-dates-of-30-minute-address-on-american-energy/
Also, if you did not get a chance to see the current President's logic-challenged speech on US energy yesterday, relax; you spared yourself a great deal of mental anquish trying to follow his convoluted thinking. The Wall Street Journal has an excellent take on that speech which is also worth reading. You can find that at the following link: It is entitled, "Stupid and Oil Prices". I especially liked the fact that the writer brought up the pernicious effect of the Fed's near zero interest rate policy on the price of energy, and commodities as a whole. It was and is a very insightful read.
http://online.wsj.com/article/SB10001424052970203918304577241623995642182.html?mod=WSJ_Opinion_LEADTop
Take a look at what has been happening to the Commodity Complex as illustrated by the CCI. The index has been in a downtrending pattern since it peaked late last spring. It is however showing some definite signs of bottoming and what is more, possibly begin a trending move higher (remember that a market can bottom without necessarily embarking on an uptrending move higher - it can merely go sideways).
The first solid chance of seeing such a thing would be an index close above the horizontal blue line noted on the chart. Upside follow through that takes out the lower upsloping red line would be then very bullish activity.

As you can clearly see, the price has rallied some 70 cents snce the end of last year without hardly a pause. It is currently closing in on a very important chart inflection point which is just shy of the $3.20 level. Based strictly on technical analysis and nothing fundamental, if this market pushes past that point (notice it is knocking right on the door of the lower line of the pitchfork - which is where it can be expected to encounter selling pressure), then not only will it have bested upsloping resistance but it will also have taken out horizontal resistance coming in near that level as well.

That would give us a technical signal that this market is going to make a run towards the all time high. I wish to emphasize again, that we are no where near the peak driving demand season for gasoline which generally coincides with the advent of the Memorial Day holiday.
Gasoline is obviously pricing in a risk premium in an attempt to pre-emptively ration supply fearing a drop in oil shipments out of the middle East should tensions with Iran further ramp up. However, this rally began prior to such fears initially moving higher in anticipation of a near zero interest rate policy of the Federal Reserve and additional liquidity being supplied by the Central Banks of the West. Even China was not left out of the equation with many traders suspecting that the Chinese would lower interest rates or reduce bank reserve ratio requirements as they indeed did.
What to bring away from all this? Simple - get ready for the very real prospect of all time high prices at the gasoline pump this summer.
By the way, Newt Gingrich has an outstanding presentation at his website for bringing down gasoline prices, permanently, and for sharply reducing American dependence on imported oil. Check it out.
http://www.newt.org/news/newt-2012-announces-first-air-dates-of-30-minute-address-on-american-energy/
Also, if you did not get a chance to see the current President's logic-challenged speech on US energy yesterday, relax; you spared yourself a great deal of mental anquish trying to follow his convoluted thinking. The Wall Street Journal has an excellent take on that speech which is also worth reading. You can find that at the following link: It is entitled, "Stupid and Oil Prices". I especially liked the fact that the writer brought up the pernicious effect of the Fed's near zero interest rate policy on the price of energy, and commodities as a whole. It was and is a very insightful read.
http://online.wsj.com/article/SB10001424052970203918304577241623995642182.html?mod=WSJ_Opinion_LEADTop
Take a look at what has been happening to the Commodity Complex as illustrated by the CCI. The index has been in a downtrending pattern since it peaked late last spring. It is however showing some definite signs of bottoming and what is more, possibly begin a trending move higher (remember that a market can bottom without necessarily embarking on an uptrending move higher - it can merely go sideways).
The first solid chance of seeing such a thing would be an index close above the horizontal blue line noted on the chart. Upside follow through that takes out the lower upsloping red line would be then very bullish activity.

Thursday, February 23, 2012
$1800 in Play for Gold
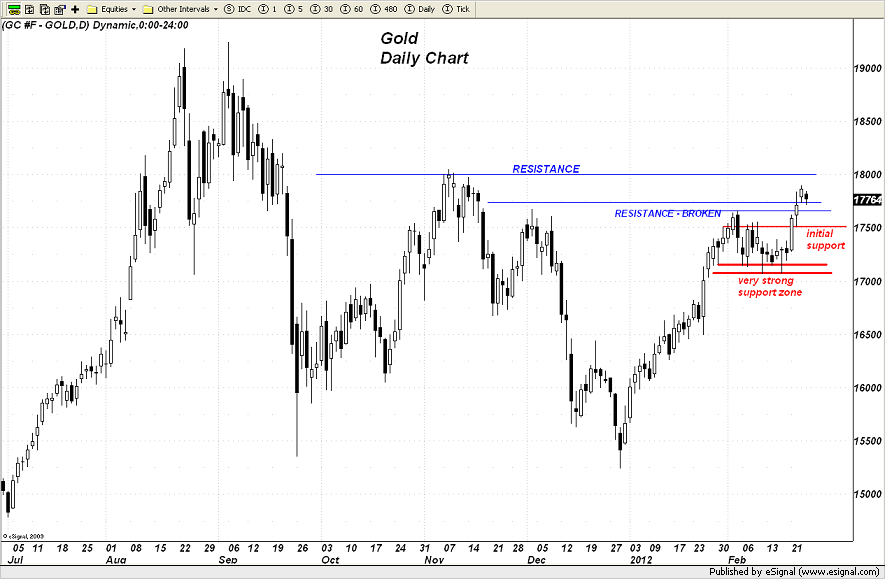
I am posting a pair of gold charts today to note the clear resistance levels on the chart and to comment accordingly.
The first is the daily chart showing the resistance zone that was broken this morning after being tested in yesterday's session. The key to that test was the ability of the gold market to SUSTAIN GAINS ABOVE the $1750 level. That was the level all momentum traders were watching to determine whether or not they were going to move in. When it appeared likely that gold was going to hold above that level yesterday, in came the hedge fund algorithms and up went the metal before it encountered a bout of bullion bank selling right at the key $1780 level.
The ability of the bulls to absorb those bids and push past that defensive barrier has set the weaker-handed shorts on their heels and is bringing in additional momentum based buying in today's session.
The result is that the market is poised for a test of a big block of resistance centering on the round number of 1800. Gold ALWAYS keys on these round numbers and has done so since it began its ascent to $300 a decade plus ago.
If $1800 gives way, then the next target is the zone near $1850.
Initial downside support comes in back near the $1750 level.

Now let's shift gears to the weekly chart where you will see two horizontal blue lines. The lower of the two comes in near $1740. This is the reason that the battle centered on that number last week and why gold bulls were stymied in their efforts to launch the metal higher. Chart focused bullion banks were aware of the significance of that level and were making every effort to hold the price from closing through that level. Once they were repulsed, they then attempted to hold the price from popping back through $1750 as the algorithms would signal their buys once price moved through that level and held.
You can see from this longer term oriented chart, the significance of the round number of $1800. That is where the next focus is shifting and it will hold as much significance as $1750 did on the way up. Gold bulls have the wind at their back right now; the big question is how much money do they want to commit to the metal in terms of position size. Certainly they are making a strong play in silver right now which will tend to benefit the gold market as well.

Silver is sitting right on MAJOR Chart resistance at $35.35 - $35.50. There is not much in the way of significant overhead chart resistance above this level until you get to $40. I might add that a bit of minor resistance appears near $39. I should also note that silver is making this move independent of the copper market which is reacting to fears of slowing demand for the red metal especially after the disappointing numbers coming out of Europe this morning. Copper stocks are building in Shanghai so some traders are reading that as a slowing of growth prospects in China, which is responsible for approximately 40% of global demand for the metal. We'll have to keep an eye on that since Silver has been more sensitive to overall global growth prospects than gold in general.

Strength in the mining shares is further aiding the move higher in both gold and silver with the HUI closing in on a key technical level on the price charts as well. Bulls have done a consistently good job in supporting these things on any dips to the bottom of the 1 1/2 year long trading range which comes in near the 500-490 level. One thing they have not been able to do is to generate enough upside price action to bring in momentum based buying which will also begin squeezing some of the shorts out, or at the very least make them rethink their continuing in that infernal ratio spread trade that has plagued this sector for nearly two years now.
If this index pushes past the line noted on this chart, there is a very good chance that the shares will begin catching a very strong bid with the potential of moving the index back to the top of that trading range closer to 590-600.

One last thing - yesterday I showed you a chart of gold priced in terms of the British Pound and how close it was to reaching its former all time high.
Today here are two more - the first is Euro gold and the second is Yen Gold. Note the strength in the charts.
Gold bears have their work cut out for them.


Subscribe to:
Posts (Atom)