"When misguided public opinion honors what is despicable and despises what is honorable, punishes virtue and rewards vice, encourages what is harmful and discourages what is useful, applauds falsehood and smothers truth under indifference or insult, a nation turns its back on progress and can be restored only by the terrible lessons of catastrophe." … Frederic Bastiat
Evil talks about tolerance only when it’s weak. When it gains the upper hand, its vanity always requires the destruction of the good and the innocent, because the example of good and innocent lives is an ongoing witness against it. So it always has been. So it always will be. And America has no special immunity to becoming an enemy of its own founding beliefs about human freedom, human dignity, the limited power of the state, and the sovereignty of God. – Archbishop Chaput
Trader Dan's Work is NOW AVAILABLE AT WWW.TRADERDAN.NET
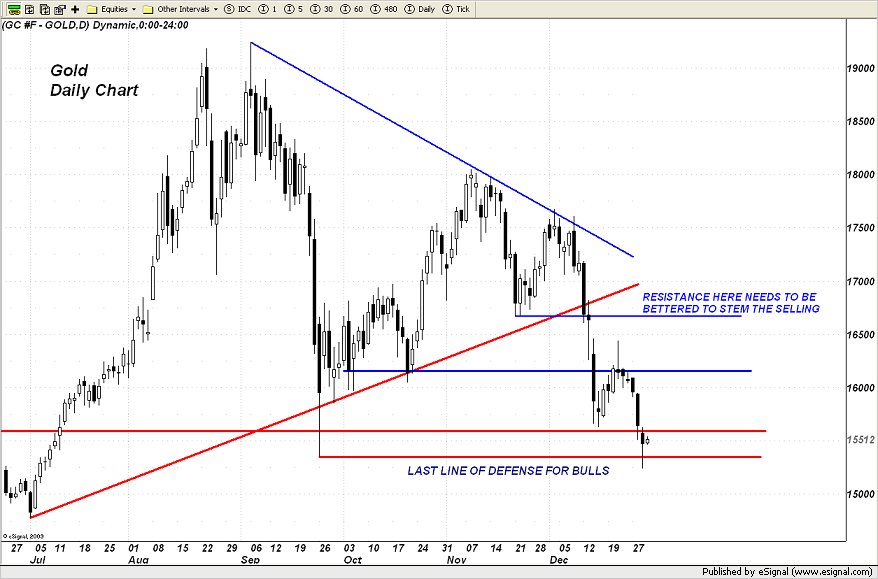
Gold, as with Silver, managed to bounce right where it needed to in order to prevent a deeper drop. It uncovered buying down near the $1,535 - $1,530 level, an area where we learned after the fact, that Central Banks had been buying back in September.
Bulls are digging in here so one can only hope that their conviction remains firm enough to take the price out of the danger zone and back above the $1,600 level. Such an event would trigger some sizeable shortcovering among the weaker-handed bears.
Failure to hold today's low sends the market almost immediately down towards $1505 - $1,500.
Last see what we get in trading tomorrow to end the day, week, month and year. Currently we are seeing buying coming into the Asian session. No doubt some of this is shorts ringing the cash register to go out on a winning note for the week.
Silver has been the on the receiving end of the risk aversion trades and as noted in a previous post has been badly lagging gold in terms of performance.
It ended last year (2010) at $28.01. As of this writing, it is currently trading near $27.74, down, but just barely on the year. Compare that to Gold which is currently trading near $1547, and remains up for the year at about 8% or so.

During the outburst of "Liquidfidous" ( a response induced by overexposure to Central Bank created liquidity), the commodity complex had experienced back to back years of outstanding gains. The years I am referring to of course are 2009 and 2010. Alas, since the watering hole has dried up, the drain has apparently opened beneath the commodity complex as a whole resulting in a losing year for this particular asset class.
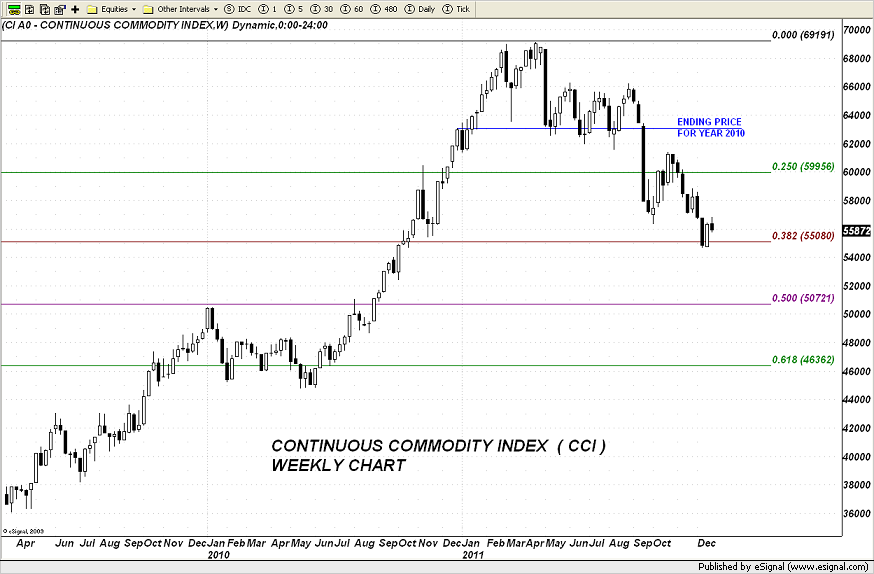
It is currently down about 11.3% from its closing levels of 2010 as speculative money flowed out of the complex when traders became convinced that another round of QE was not forthcoming right away. April marked the high water mark for this sector as traders anticipated the end of the QE2 program on time a mere two months later. From that point, the complex has been unable to mount any impressive rallies and has been in a slow grind lower.
You can see on the following chart however that the move lower has brought the index into the 38.2% Fibonacci retracement level from the low made in 2008, from which it did manage to bounce higher although the move has thus far not been very impressive. It is an understatement at this point to say that the hot money crowd is more concerned with slowing global growth and the backwash from the European Sovereign Debt issues and downgrades than it is with any inflationary outbreak. In such an environment, cash becomes king and that is why we are seeing the Dollar rally and Treasuries holding near record highs.
If the complex can attract enough interest however at the start of the New Year, and manage to claw its way back abovce the 600 level, there is a chance we have seen the worst for commodity prices overall. This would benefit the silver market which has fallen down to major support at 26 in today's trade.
If however we see a continuation of this deflationary mindset when trading commences next week and the index falls below the recent low, it could be a rough ride for the next few months in this complex as there really is no substantial chart support until we reach the 50% retracement level down near 507 - 500. If prices were to somehow breach that level and fail to quickly recover, the economy would be in serious, serious trouble.
Central Bankers are no doubt monitoring all of this and have certainly been discussing potential actions should things go from bad to worse. They probably feel that they now have more room to act seeing that prices of both food and energy have fallen well off their previous peak levels thereby eliminating the inflation fears that accompanied the first rounds of liquidity injections.
Next year should certainly prove to be very intersting indeed.
Silver has become the victim of the deflationary mindset trade with RISK AVERSION leading to a significant outflow of speculative money from the grey metal. I have said repeatedly that Silver will not go anywhere as long as INFLATIONARY FEARS are NOT foremost in traders' minds.
Note the following Gold/Silver ratio chart which details this exact thing. This ratio began moving in favor of Silver only after the Federal Reserve first announced and then began its Quantitative Easing programs back in late 2008. You can see the line beginning a steady decline as Silver appreciated at a faster rate than Gold during rallies as well as holding its losses to a minimum compared to the Yellow Metal during any setbacks in prices for both metals.
Not until the Fed confirmed the ending of the QE2 program and traders began worrying about a slowdown in the amount of liquidity being supplied to the markets did this ratio begin to reverse and move in favor of gold. Another way of saying this is that during any sort of DEFLATIONARY mindset, gold will hold its value much better than silver, which is still being viewed as a risk asset instead of as a monetary metal by the bigger players.
As the line of the ratio now advances, one can see that as long as traders are concerned over a slowdown in overall economic growth, whether from conditions in Europe or even from a slowdown in Chinese growth to a lesser degree, the trend is higher for this ratio.
Not until or unless the trading community becomes convinced that concerted CEntral Bank activity to supply further additional liquidity is imminent, will this ratio reverse and Silver begin to outperform gold to the upside once again.
The mining stocks are on course for a losing year, one which has been extremely disappointing for those who bought the shares in anticipation of higher gold and silver prices, only to see that take place but then having to witness the spectacle of the shares themselves lagging poorly over the last 12 months. Between Hedge funds playing that infernal Spread trade and "Risk Aversion" related selling, they could not get anything going.
Toss in the fact that more and more those looking for leveraged exposure to gold and/or silver, can buy the ETF's directly, thereby eliminating exposure to such variables as poor management, strikes, nationalization fears, environmentally-related litigation issues, risking input costs, and it seems that the shares are falling out of favor with the hot money crowd. Something will have to change on this front next year to see this sector attract consistent buying. Dividends might help somewhat but whatever it is, management is going to have to get creative to engender "value" in the eye of the big-monied investment crowd. Either that or sit there and watch the money flow into the ETF's and away from their companies.
Taking a look at the weekly chart, one can see where the HUI ended the year of 2010 and where it is currently trading. It is now down 15.4% for the year.
Quite frankly the chart looks extremely heavy right now as the buying that has been appearing for more than a year down near the 500 level and just below has seemingly evaporated. It could be a case where those buyers are simply unwilling to add to losing positions before the year end for the sake of dressing their books as much as possible and are waiting for the start of trading next Tuesday in the New Year to start accumulating again. Let us hope so because if they do not, and the HUI cannot get back inside that more than year long trading range, the gold shares are going to drop where we could potentially see this index down near 440 before any buying emerges.
You will notice that for the entirety of this year, any dips in this index below 500 have been of the nature that they are SPIKE LOWS. That means the shares sell off sharply but then rally back during the course of the week to end the week well off the low that was just made. We still have TWO TRADING DAYS left for the mining shares to climb higher and thus negate some of the ensuing technical damage that is going to take place is they do not, but the bulls had better perform HERE and NOW.
While volume is very, very low and trading is thin, it tends to exaggerate movements in price. Still, the price action is horrible as the index is now 56 POINTS above the level at which it ended the year 2009! If it cannot get back up inside that trading range between 500 and 600 right away, I see no chart support until near the 460 level initially followed by 430.
Long term holders of these shares need to be very vigilant to monitor developments down here.
Unless we get some sort of unexpected fundamental news such as an eruption of tensions in the Straits of Hormuz or some sort of economic news pertaining to sovereign debt-related downgrades, etc., gold looks to go out rather quietly for the year. Trading conditions are EXTREMELY THIN and volume is practically non-existent signifying the lack of interest on the part of the speculative community to take on any positions of size before the year's end in gold, or for that matter, much of anything at this point.
Traders seem mostly content to ride what they have into the New Year and reassess things when the full contingent of traders will be back at the start of the New Year. This trader is doing the exact same thing. Quite frankly, these last few months have been so extremely volatile that any sort of break from the incessant up and down, up and down, up and down, is most welcome. Why bother subjecting oneself to any more of the madness than is absolutely necessary. After all, the markets are not going anywhere and will be sitting there waiting for us all next year.
That being said, let's take a quick summary of where things stand for the yellow metal as we draw near to the end of this year.
The long term monthly chart shows gold in a very strong uptrend, with price still contained within the upchannel drawn off the low made back in late 2008, just as the Fed undertook its QE1 program and began providing liquidity to the markets.
Note I have shown two different sets of Fibonacci retracement levels to provide some perspective. The first set shown in RED, details the entire move going back nearly a decade. You can see that the retracement back lower in price, has not even reached the minimum 23.6% retracement level shown in red ($1480 - $1475). In other words, the price dip after reaching $1900 has been rather negligible on the long term chart.
Even if we start with the low made in 2008, the market has just breached that minimum 23.6% retracement level but remains well above the next level of 38.2%. Theoretically, gold could correct as far down as $1450 and still remain in a strong uptrend.
That being said, there are some warning signs on this same chart that should not be overlooked. Taking a close up of the same chart but narrowing in on the more recent months, one can clearly see the DOUBLE TOP formation near the $1900 which was confirmed by the BEARISH OUTSIDE REVERSAL MONTH pattern.
That signal occurs when a market goes on to make yet a new high but then fails to extend its gains and begins selling off. The sell off takes the market BELOW the low from the previous bar or candle thus forming a bar that has a HIGHER HIGH and a LOWER LOW. This is a very negative pattern that will dominate the chart UNLESS OR UNTIL the HIGH OF THAT BAR is taken out decisively. This is currently what we have going on in gold.
What bulls need to be concerned about would be a DOWNSIDE PUSH BELOW the horizontal RED support line labelled, "critical support". Were that to occur, price would then be on target to drop back down towards the former support levels noted on the first chart shown above. That comes in below $1500 beginning near $1480 and extending lower towards $1450. Failure there would see gold possibly drop as low as $1300 before gaining any traction.
If you note the second chart below, the one detailing the entire move from $250 to $1900+, you can see that its 38.2% retracement level (SHOWN IN RED) comes in at $1290. Meanwhile the upper chart shows a 50% retracement level coming in near $1310. Between the two of these points, we could expect chart support to emerge, should prices indeed drop this low.


Gold is stuck in a broad trading range between $1550 on the bottom and $1750 on the top. In the abscense of any fundamental news, it will more than likely end the year within this range.