The financial press is announcing that Barrick Gold raised its quarterly dividend today by 25% to $0.15/share.
Every time a miner does something like this, it makes it that much harder for the short sellers to go in and play.
Wednesday, October 26, 2011

Gold hits resistance at $1720; holding gains
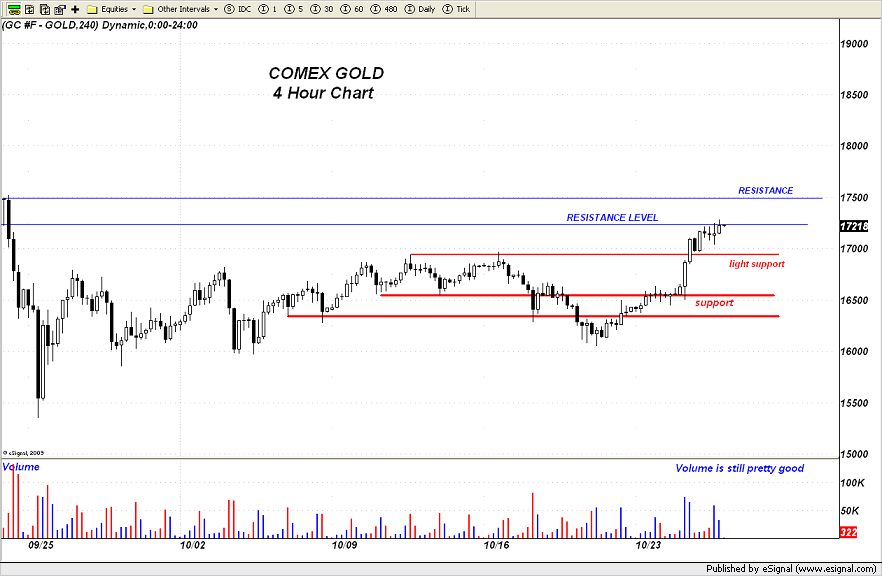
Gold has run exactly to the projected resistance level on the charts, backed off a bit, and then encountered additional buying which is keeping it well supported at the current hour.
It might be a bit early but it seems as if we might be seeing the gold market anticipating some sort of QE3 coming from the Fed sooner rather than later. The fact that it is acting as a safe haven and is shrugging off any weakness in equities and strength in the US Dollar is very telling. We'll see if this new pattern continues to hold in gold.
If gold plows through the resistance level noted on the chart near $1720, it looks to have a fairly clear path to $1750 or so. Volume on the move higher remains pretty decent.
Downside support likes first near $1680 followed by better support at $1650.

It might be a bit early but it seems as if we might be seeing the gold market anticipating some sort of QE3 coming from the Fed sooner rather than later. The fact that it is acting as a safe haven and is shrugging off any weakness in equities and strength in the US Dollar is very telling. We'll see if this new pattern continues to hold in gold.
If gold plows through the resistance level noted on the chart near $1720, it looks to have a fairly clear path to $1750 or so. Volume on the move higher remains pretty decent.
Downside support likes first near $1680 followed by better support at $1650.
Euro Gold chart
Once again gold is getting a very firm bid even as weakness appears in the broader US equity markets. News out of Europe continues to leave traders unimpressed as once again those various nations prove why the idea of creating a single monetary union and a single political union out of a group of such disparate countries cannot ever hope to succeed.The differences between the nations of the north and the nations of the south cannot be more stark.
Quite frankly, those citizens of the countries that are on relatively solid financial footing are rightfully indignant that their wealth should be used to prop up those countries whose political leaders spent their own country into ruin. The situation would be akin to US taxpayer dollars being sent to prop up Mexico.
One outcome of this is fear - fear that the cracks in the monetary union are going to worsen. This is leading to selling in the Euro. What it is also doing is driving money on the Continent into gold.
Take a look at the following Euro-gold chart and note how relatively firm it continues to trade. It is currently about 120 euros off its all time high and is on track for a very firm weekly performance.
If you also note, the price accelerated quite sharply beginning in late June/early July and moved up out of the price channel that for the most part has defined its trend going back into the bottom it made in late 2008. This is what happened to US dollar-priced gold which got ahead of itself somewhat before correcting and spinning off some froth out of the market.
Let's see how this closes for this week to see whether or not it can strongly surpass the 1260 level. Ideally the market would begin another price channel with a base at a elevated level and not one of those nearly vertical rocket shots which are not sustainable and tend to run out of steam and then give back most of the gains.

Quite frankly, those citizens of the countries that are on relatively solid financial footing are rightfully indignant that their wealth should be used to prop up those countries whose political leaders spent their own country into ruin. The situation would be akin to US taxpayer dollars being sent to prop up Mexico.
One outcome of this is fear - fear that the cracks in the monetary union are going to worsen. This is leading to selling in the Euro. What it is also doing is driving money on the Continent into gold.
Take a look at the following Euro-gold chart and note how relatively firm it continues to trade. It is currently about 120 euros off its all time high and is on track for a very firm weekly performance.
If you also note, the price accelerated quite sharply beginning in late June/early July and moved up out of the price channel that for the most part has defined its trend going back into the bottom it made in late 2008. This is what happened to US dollar-priced gold which got ahead of itself somewhat before correcting and spinning off some froth out of the market.
Let's see how this closes for this week to see whether or not it can strongly surpass the 1260 level. Ideally the market would begin another price channel with a base at a elevated level and not one of those nearly vertical rocket shots which are not sustainable and tend to run out of steam and then give back most of the gains.

Tuesday, October 25, 2011
HUI attempting to make up lost ground against the S&P 500
If one goes back to the beginning of July of this year, you can see that for the next two months, the mining shares were outperforming the broader equity markets as a whole.
Once September rolled around, the shares gave back their gains against the broader market and severely underperformed. With today's strong surge higher, we might be seeing the reversal of this recent lagging in terms of performance.
Much depends on the willingness of traders to see gold and silver as "SAFE HAVENS" and not as part of the broader risk trade. The reason the mining shares are doing so well in today's session, especially with the broad based selling across the general equity world, is that traders/investors have re-awakened to both gold and silver as safe havens in the midst of some very palpable fears about the shaky European debt crisis. As money flows have returned to those precious metals, flows are also coming into the mining shares which will of course benefit if the metals continue to move higher.
One day a trend does not make but this is such a drastic departure from recent behavior that it must be noted and also closely watched to see if this is the start of something significant.
As a side note - if the chart pattern is moving higher, the HUI is outperforming the broader US equity markets. The opposite is true if the pattern is moving lower. Note the sharp surge higher in this ratio and the breach of the downtrend.

Once September rolled around, the shares gave back their gains against the broader market and severely underperformed. With today's strong surge higher, we might be seeing the reversal of this recent lagging in terms of performance.
Much depends on the willingness of traders to see gold and silver as "SAFE HAVENS" and not as part of the broader risk trade. The reason the mining shares are doing so well in today's session, especially with the broad based selling across the general equity world, is that traders/investors have re-awakened to both gold and silver as safe havens in the midst of some very palpable fears about the shaky European debt crisis. As money flows have returned to those precious metals, flows are also coming into the mining shares which will of course benefit if the metals continue to move higher.
One day a trend does not make but this is such a drastic departure from recent behavior that it must be noted and also closely watched to see if this is the start of something significant.
As a side note - if the chart pattern is moving higher, the HUI is outperforming the broader US equity markets. The opposite is true if the pattern is moving lower. Note the sharp surge higher in this ratio and the breach of the downtrend.

Gold Breaks out
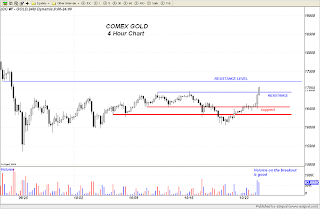
Gold bulls finally managed to beat back the line of defense erected by the perma shorts at the Comex in today's session as safe haven buying came into gold from all quarters early in the session and continued to build as it wore on. The technical breakout above resistance also brought in both short covering and new momentum based buying.
Volume on the upside move has been very good which is generally regarded as confirmation to the validity of the breakout.
The next technical target lies near the $1720 level.
Downside support now moves up towards $1680 with much better support near $1650.
Helping confirm the move is the surge in both the mining shares as evidenced by the HUI and the upside breakout above $32.50 in Silver.
Note on the silver chart that the market is currently up against the 50% retracement level of the most recent leg down. Clearing this should allow it push first towards $34 and then up against the $35.15 - $35.25 level.
Downside support levels are first near $31 and then back down towards $30.

Volume on the upside move has been very good which is generally regarded as confirmation to the validity of the breakout.
The next technical target lies near the $1720 level.
Downside support now moves up towards $1680 with much better support near $1650.
Helping confirm the move is the surge in both the mining shares as evidenced by the HUI and the upside breakout above $32.50 in Silver.

Note on the silver chart that the market is currently up against the 50% retracement level of the most recent leg down. Clearing this should allow it push first towards $34 and then up against the $35.15 - $35.25 level.
Downside support levels are first near $31 and then back down towards $30.

Silver and Copper are parting ways today
Both of these metals have been moving in lockstep recently as risk trades were either jammed on or taken off. Silver has been trading like an industrial metal during such times. Today it is moving like a safe haven metal. Very interesting developments to say the least.
In the process it is now trading solidly above critical resistance near the $32.50 level. If it can hold these gains, it will be on target for a shot towards $34.
In the process it is now trading solidly above critical resistance near the $32.50 level. If it can hold these gains, it will be on target for a shot towards $34.
Is Gold resuming its Safe Haven Status?
In a departure from recent price action in which it has been acting more like a "risk" asset rather than a safe haven asset, gold is moving higher alongside of both the US Dollar and the US Treasury market. It appears that traders are becoming increasingly "jittery" over developments in Europe concering the bank recapitalization plan and the Stability Mechanism. Safe havens flows are definitely returning to gold based on what we are witnessing today.
Thus far the volume has been very strong on the breakout above key resistance at the $1680 level with the market challenging overhead psychological resistance at the $1700 level. If gold can put on a handle of "17", it will get the attention of money that has been sitting on the sidelines as well as putting some further pressure on shorts.
I will get a chart up a bit later towards the end of the session today as I want to see how it does for another couple of hours.
Thus far the volume has been very strong on the breakout above key resistance at the $1680 level with the market challenging overhead psychological resistance at the $1700 level. If gold can put on a handle of "17", it will get the attention of money that has been sitting on the sidelines as well as putting some further pressure on shorts.
I will get a chart up a bit later towards the end of the session today as I want to see how it does for another couple of hours.
Monday, October 24, 2011
Let's Play "Guess a Chart"
Take a look at the following TWO charts and see if you can notice how similar the two of them are.
You can tell that both charts, while not identical, are eerily similar in the manner in which they depict the overall price action.


The top chart is the S&P 500. The lower chart is Crude Oil.
They both tend to move up at the same time, mover lower at the same time and grind sideways at the same time.
What these charts tell us is that there is no longer any SERIOUS INVESTMENT "STRATEGY" in today's financial markets. All that they are doing is reflecting either the willingness of the HEDGE FUNDS to take on RISK TRADES or to FLEE from RISK.
On any given day, if the risk trades are on, these nitwit hedge fund managers buy everything in site except for US TREASURIES or the US DOLLAR. If the following day brings in risk aversion trades, they throw away everything purchased the previous day and do the exact opposite.
Truth be told this sort of thing has nothing to do with INVESTING. It has everything to do with MONEY FLOWS generated by computer algorithms. This sad state of affairs is what Central Bank interventions and constant interference into the financial markets has reduced our markets to.
Traders have to put aside their personal disgust at this madness and trade accordingly if they wish to profit. Still, in this trader's opinion, this is one more symptom of the decline of the West. No longer is the stock of various companies bought because of long term prospects for solid profits based on solid research and good analysis. Instead it goes up based on whether or not the Central Banks will spit more liquidity into the marketplace.
Heaven help us all.
Subscribe to:
Posts (Atom)