Saturday, January 21, 2012
Trader Dan on King World News Weekly Metals Wrap
Please click on the following link to listen to my regular weekly radio interview with Eric King on the KWN Weekly Metals Wrap.
Friday, January 20, 2012
Ten Year Note Interest Rate Rising
The Ten Year Note Interest Rate has been trading in a range between 1.80 and 2.10 or so for the better part of the last three months. Rates would move higher on improving economic data coming out of the US or China but then retreat on any sour news particularly coming out of Europe.
This week saw rates drop on Monday and stay stagnant on Tuesday but for the remainder of the week, they were on a tear higher. This is attributable to changing sentiment in regards to the global economy, especially in relation to fears surrounding the European debt situation. When traders saw French and Spanish debt finding buyers, they dismissed contagion fears and rapidly shifted from risk aversion trades to risk trades. In other words, they dismissed Deflation concerns and began leaning towards Inflation concerns in association with the tremendous amounts of Central Bank liquidity being supplied to deal with these issues.
Note this chart carefully for it is, in my opinion, a roadmap as to where Silver is headed in particular and to a lesser extent, gold. There is the POTENTIAL, (please note the emphasis) for rates to have bottomed. If that is indeed the case, then we are going to see strong rallies in Silver and in gold as the inflation trade (RISK ON) will be back in vogue. I would want to see this chart get a WEEKLY CLOSE above 2.25% to feel that we are now leaving the period of low interest rates behind us. Keep in mind that we could still see eruptions out of Europe at any time and that is going to keep traders on edge a bit but if the investing/trading community becomes convinced that we are now past the debt meltdown stage and will be dealing with INFLATION next, then this chart is going to show it.

Certainly, if we get that weekly close above 2.25%, then precious metals should begin to react accordingly as risk capital, that has been on the sidelines begins coming back into both the gold and silver markets.
As always, time will tell. We do not need to be soothsayers or attempt to divine patterns in those silly wave charts to realize that a changing interest rate environment will signal the onset of a new period of investment factors that will have to be adjusted to.
Silver on Track to Challenge $32.50
ON Wednesday of this week, silver finally managed to get a CLOSE above strong chart resistance at the $30 level. The next day, while it was unable to advance much, it refused to back down below that resistance level and eked out another close above $30. Two consecutive closes above a strong chart resistance level and the bears had no choice but to begin running. Fresh money is now chasing them out as it appears that the hedge funds are beginning to move back into the grey metal after having fallen out of love with it in December of last year.
The technical chart picture is much improved with all momentum indicators now in a bullish mode on the daily chart as price is trading ABOVE the 50 day moving average in today's session. The 20 day moving average is now turning higher indicating the short term trend has flipped up. The 50 day should prove to be some support if we get some retracements lower.
A strong finish to the session today will set this market firmly on track for a test next week of another band of formidable chart resistance centered near the $32.50 region.
Note that the short term downtrend line drawn off the August 2011 peak was broken last week but that horizontal resistance at $30 had not as of yet fallen until it was bettered this week.
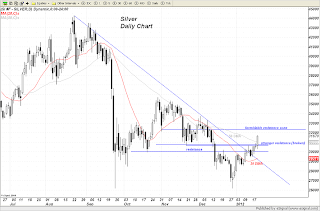
If the bulls can take out $32.50 next week, they should have relatively clear sailing all the way to $35 which is where one helluva battle royale is going to be waged by the perma bears. If that group fails to stem the advance, this market has a real shot at launching an upside trending move.
It should be noted that the move higher in silver is being accompanied by a sharp move LOWER in the bonds. Bonds are breaking down on their price chart indicating the LACK OF RISK AVERSION trades at the current moment. Keep in mind what I have repeatedly said - Silver will outperform gold in an environment in which RISK is IN. That is what the movement in the bond market is suggesting.
Only a sharp reversal to the upside in the bond market would derail the move higher in silver as it would be accompanied by a downside move in equities and a move higher in the US Dollar once again. Such an event would signal that investment funds would be back to shunning risk with money flowing back out into cash and cash equivalents and away from "risk assets".
Thursday, January 19, 2012
Gold attempting to fight off pressure from sagging gold stocks
Once again the weakness in the gold mining shares is leading to weakness in gold as the yellow metal fights to retain its footing above the $1650 level. This is occuring even as the US Dollar is weakening and a general bid is coming into the commodity sector overall.
The HUI is down nearly 2% at the time of this writing even as the S&P 500 is up 2/3 of a percent. Note that the HUI to Gold ratio it is currently pressing into levels which saw a low made last year, a level which I might note was commensurate with where it was trading way back nearly three years ago.
No matter how you analyze it, the gold miners are so cheap compared to the price of bullion that it is difficult for me to envision how we are NOT going to see takeovers, mergers or acquisitions. If someone wanted a fire sale, they are surely getting one on some of these firms.

One other side note, the long bond is getting whacked today (down almost a full two points) as traders apparently took the news that Spain and France were able to peddle their debt to some fool somewhere as proof that the situation in Europe is not all that dismal. In other words, even though Greece continues to lurk in the background, investors/traders are basically ignoring the problems there now as they rush back into the Euro which some now feel is undervalued. Yep, another episode of "How the Hedge Fund World Turns" is on television for us all to witness.
Note the following chart of the long bond and the weakening chart pattern. A technical breakdown (while not here YET) would signify that the market is anticipating a RISE in longer term interest rates. The bonds seem to have reached a level that they are unable to rise above ( if they do, it will herald the onset of a massive deflationary event) and are thus retreating. Still, the bears are unable to break this market down signficantly due to lingering concerns in the background of traders' minds about the potential for more bad news out of Europe.

Wednesday, January 18, 2012
Gold clears $1650; looks firm
Gold has now managed two consecutive closes above chart resistance near $1650 and is looking firm at this hour. It has a very good shot at testing resistance at $1675- $1680 where it should experience some fairly heavy selling. If the bulls can break through that line, we should see a handle of "17" in front of the metal.
Weakness in the Dollar is aiding the progress of the metal higher.
Downside support comes in near $1640 - $1635 initially followed by $1620.
Silver is benefitting from risk trades being put back on as it and copper are both seeing decent inflows of investment money from hedgies. This is the first close ABOVE $30 for silver in over a month. Follow through in tomorrow's session should see it make a run towards the $32.50 level, which is what stands between it and a push to $35.

The Ultimate Inflation Casualty
We've all seen the tricks being played by food manufacturers in shrinking the size of their products but charging the same price as the former size. The old 5 pound bags of sugar some to my mind. Whether it is cereal or bar-b-sauce, or whatever, the consumer ends up paying the same amount as they once did but they come home with a smaller quantity for their money spent.
All of this is to hide or disguise the impact of inflation. One goes to the store, buys a bag of sugar for the price they paid for it a few years ago and thinks little if anything about it until they realize that they ended up with one pound less sugar than they might have assumed.
Now, I give you the ULTIMATE INFLATION CASUALTY - yes indeed - the lowly but glorious roll of toilet paper.
Look at the following picture and weep for our old familiar friend... the roll of toilet paper on the right is the old sized roll. The new, inflation adjusted roll is on the left - I actually took out a ruler and measured the thing - it is 5/16" of an inch narrower. Think about how much wood pulp that saves the paper manufacturer. The result - VOILA! the package of the new paper costs as much as the old sized rolls cost but you get that much less.
Alas, let us pause for a moment of respect at the passing of the dear friend of our derriere.

Tuesday, January 17, 2012
Gold stocks continue being plagued by the hedge fund ratio trade
The HUI continues to lose value against the price of gold bullion as evidenced by a continued deterioration in the ratio of the price of the HUI to the price of an ounce of gold.

We are reminded continually of two things that have led to this abysmal performance of the gold shares which are rapidly losing speculative interest in favor of the ETF.
The first is the risk of investing in companies that are subject to surprises which happened to Hecla and recently to Kinross. Hedge funds and other large investment groups or players seeing this say to themselves, "Why risk this sort of thing when we can get LEVERAGED EXPOSURE" to the gold price by buying the gold ETF on margin".
There is no such risk inherent in the ETF. No one worries about nationalization of the ETF or environmental lawsuits or some bureaucratic agency shutting it down to clean up debris in a mine.
Secondly -this then leads us to the ratio spread trade. Buy the actual metal either through the ETF or the physical stuff (or even the Comex) and take a corresponding short position in some of the mining companies to further minimize the risk of investing in gold.
This shows up in the rotten performance of the gold shares in general as they continue to decline against the price of bullion . Note that the line goes nearly straight down since the beginning of 2011 with a brief exception of a lousy two months last year.
If one wanted to devise a mechanism to deliberately depress the price of the mining shares they could not have come up with a better mechanism to do so than the gold ETF. The lesson in this is that investors must be extremely selective in choosing gold mining companies to invest in and not just blindly throw money into the sector and thereby hope to be successful. As long as the Gold ETF is in existence, the hedge funds are going to use it as the long leg of these spread trades and actively seek out the weaker gold mining companies to short. At this point I am not sure what it is going to take to reverse this trade as traders will stick with a strategy as long as it works and not a day longer. Long suffering gold mining share owners should continue to press management to take the steps necessary to make it more difficult to short their shares successfully. Failing that they can always pray for a takeover or acquisition!
GFMS reports substantial offtake of Gold by Central Banks
Dow Jones news is carrying a report this morning from GFMS (formerly Gold Fields Mineral Services)detailing the amount of gold purchased last year by the world's Central Banks. It was indeed a formidable number.
The net purchases of the yellow metal came in near 430 tons, a more than 5-fold increase on the previous year. It was also the highest level recorded since 1964.
To give you a sense of the significance of these purchases - the amount of NET purchases by Central Banks in 2010 was a mere 77 tons!
Surprising to me was the fact that Mexico was the largest buyer as far as the official monetary sector goes. GFMS reports that they added almost 100 tons of gold to their reserves. I would have thought it would have been China to lead the pack.
The other surprising fact was that signatories to the Central Bank Gold Agreement ( this was set up to limit the amount of gold sold by European Central Banks ) sold less than 10 tons for 2011.
The summary - Central Banks are now absorbing a significant amount of world gold production. This should continue to provide very good downside support for the metal on price retracements lower as these banks do NOT CHASE PRICES HIGHER but are there to buy at levels they consider gold to have "value".
Subscribe to:
Posts (Atom)