Traders seem mostly content to ride what they have into the New Year and reassess things when the full contingent of traders will be back at the start of the New Year. This trader is doing the exact same thing. Quite frankly, these last few months have been so extremely volatile that any sort of break from the incessant up and down, up and down, up and down, is most welcome. Why bother subjecting oneself to any more of the madness than is absolutely necessary. After all, the markets are not going anywhere and will be sitting there waiting for us all next year.
That being said, let's take a quick summary of where things stand for the yellow metal as we draw near to the end of this year.
The long term monthly chart shows gold in a very strong uptrend, with price still contained within the upchannel drawn off the low made back in late 2008, just as the Fed undertook its QE1 program and began providing liquidity to the markets.
Note I have shown two different sets of Fibonacci retracement levels to provide some perspective. The first set shown in RED, details the entire move going back nearly a decade. You can see that the retracement back lower in price, has not even reached the minimum 23.6% retracement level shown in red ($1480 - $1475). In other words, the price dip after reaching $1900 has been rather negligible on the long term chart.
Even if we start with the low made in 2008, the market has just breached that minimum 23.6% retracement level but remains well above the next level of 38.2%. Theoretically, gold could correct as far down as $1450 and still remain in a strong uptrend.
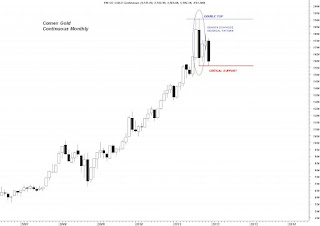
That being said, there are some warning signs on this same chart that should not be overlooked. Taking a close up of the same chart but narrowing in on the more recent months, one can clearly see the DOUBLE TOP formation near the $1900 which was confirmed by the BEARISH OUTSIDE REVERSAL MONTH pattern.
That signal occurs when a market goes on to make yet a new high but then fails to extend its gains and begins selling off. The sell off takes the market BELOW the low from the previous bar or candle thus forming a bar that has a HIGHER HIGH and a LOWER LOW. This is a very negative pattern that will dominate the chart UNLESS OR UNTIL the HIGH OF THAT BAR is taken out decisively. This is currently what we have going on in gold.
What bulls need to be concerned about would be a DOWNSIDE PUSH BELOW the horizontal RED support line labelled, "critical support". Were that to occur, price would then be on target to drop back down towards the former support levels noted on the first chart shown above. That comes in below $1500 beginning near $1480 and extending lower towards $1450. Failure there would see gold possibly drop as low as $1300 before gaining any traction.
If you note the second chart below, the one detailing the entire move from $250 to $1900+, you can see that its 38.2% retracement level (SHOWN IN RED) comes in at $1290. Meanwhile the upper chart shows a 50% retracement level coming in near $1310. Between the two of these points, we could expect chart support to emerge, should prices indeed drop this low.
So much for the bearish scenario. In order to get something going to the upside, bulls need to target and then take out the failed attempt to extend back towards $1900 which occured last month (November) when gold could not push past $1800 after a strong rally off of the $1550 level took place. That failure was the signal for market bears to become more aggressive and those longs with profits wishing to book them to do so before they vanished. The combined selling has led to a fairly substantial sell off as we moved through the month of December and head for year's end. If, and that is a big "IF", bulls can take out $1800, there is little in the way of chart resistance showing up until we get back to the recent all time highs near $1900. If the market can take out this level, and I expect a FEROCIOUS fight from the bullion banks to prevent this as they full well know the implications of a breach of a former all time high, then gold will see a handle of "2" in front of it very, very quickly, before the month of January 2012 is out with solid potential to reach $2100 sometime in February.
As always with markets, only time will tell. Everything else is mere speculation.


