"When misguided public opinion honors what is despicable and despises what is honorable, punishes virtue and rewards vice, encourages what is harmful and discourages what is useful, applauds falsehood and smothers truth under indifference or insult, a nation turns its back on progress and can be restored only by the terrible lessons of catastrophe." … Frederic Bastiat
Evil talks about tolerance only when it’s weak. When it gains the upper hand, its vanity always requires the destruction of the good and the innocent, because the example of good and innocent lives is an ongoing witness against it. So it always has been. So it always will be. And America has no special immunity to becoming an enemy of its own founding beliefs about human freedom, human dignity, the limited power of the state, and the sovereignty of God. – Archbishop Chaput
Trader Dan's Work is NOW AVAILABLE AT WWW.TRADERDAN.NET
It was mere weeks ago when we got the news that the ratings agency, S&P, had downgraded Japanese debt to 'AA-'.
Now comes the news of another downgrade of the same, this time from Moody's.
Both agencies cited structural issues which will make it very challenging for Japan to deal with its chronic debt problem, which most predict will reach more than 200% of GDP later this year.
One has to wonder at what point it will be before we get an end to this unthinking, blind panic into bonds at the first whiff of a crisis anywhere around the globe.
Here is the full story from Bloomberg.
http://www.bloomberg.com/news/2011-02-22/japan-s-aa2-government-debt-rating-outlook-changed-to-negative-by-moody-s.html
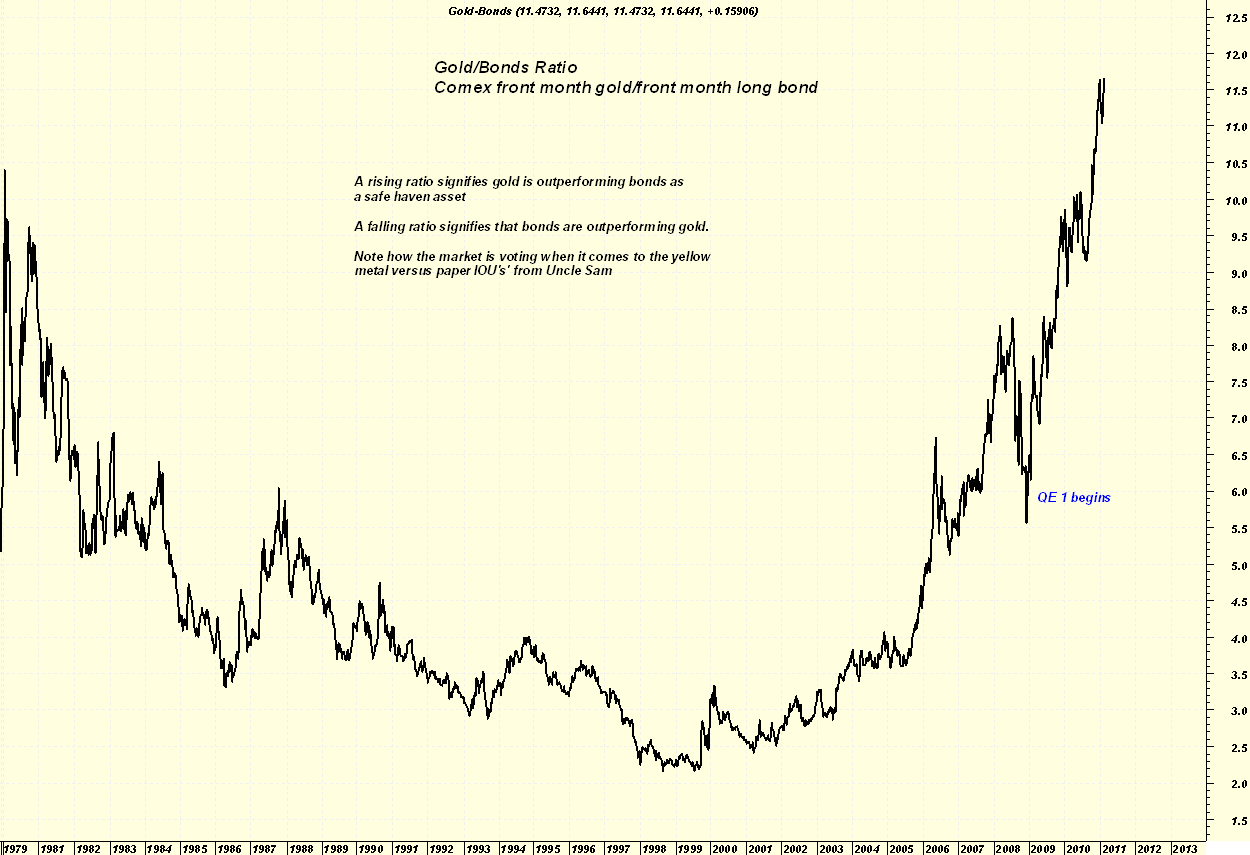
Here is a chart comparing the gold price to the long bond in a gold/bond ratio. This ratio basically details in picture form which of the two so-called "safe haven" assets is performing better.
One look at the chart tells us which way Mr. Market is voting. (Hint - it ain't bonds even with this reflexive rush into them due to the current unrest in the mid-East). Ever since Quantitative Easing was announced, the paper IOU's have been lagging far behind gold in terms of preserving their holders' wealth.
Dear Friends;
The following chart details some potential levels of chart resistance for silver based on a series of Fibonacci projections. Keep in mind that we are basically working with educated guesses here since data from 30 years ago loses a great deal of relevance in my opinion. Does anyone really believe silver at $33 today has the same value as silver at $33 thirty years ago? In other words, we might as well be working with silver as if it is trading in uncharted territory and go from there.
Eventually the market will determine those new levels of resistance by its behavior as well as new levels of chart support, but for the time being, the levels shown on the chart, and the behavior of the silver market as it approaches these levels, will tell us a great deal about this market, much more than the analysts themselves can tell us.
Note also that I am using the weekly chart for the metal giving this chart a longer term perspective.
Simmering tensions in the Middle East, particularly in Libya, a major oil producer, sent gold bears scurrying for cover today and brought in a wave of safe haven related buying.
That buying enabled gold to smash through upside chart resistance near $1,400 in the process. Last week gold had ended on a strong technical note, having cleared the selling coming in near the $1385 level with relative ease. Today it built on those gains as it now appears to have caught the attention of the momentum crowd in a much larger way. It had been grindly steadily higher, helped to no small extent by its star next door, silver, but today it seemed to be moving on its own merits.
The fact that the unrest which began in Tunisia, spread across to Algeria, Egypt, Iran and now Libya, seems to be growing instead of abating, has unnerved more than a few investors, and particulary buyers of crude oil, which shot up more than $5.00/barrel today even as Brent crude went on to make a new 29 month high at $105. With crude oil soaring and the mid-East unstable, gold is seeing very strong safe haven flows. Even the utterly useless IOU market, that would be the US long bond, was higher today, benefitting from that same desire for safety (there - I brought myself to say the two words together; "bonds" and "safety" even as unpleasant as that is to do - excuse me now while I go and wash out my mouth to get rid of the horrible taste).
The result of all this has been to turn the technical price chart very bullish the shorter term 10 day moving average has now completed a bullish upside crossover of the 40 and 50 days. The 20 day is also now running firmly higher and looks to be on track to complete its own upside bullish crossover in the next two or three days. All of the major moving averages are now moving in the same direction, namely higher. That indicates that the market is in a trending phase and should engender buying on dips in price.
First order of business for the bulls is to take it up through $1420 to clear a path for a run towards its all time high near $1432. Having taken out $1400 in convincing fashion, we should now see the recent resistance level down near $1385 acting as a support level on any dips in price.
I did find it rather interesting to note that even with all this safe haven buying taking place and a surge in investor caution, the US Dollar did not receive much of a bid today. I am not sure that is a harbinger to come but it does not speak well for the Dollar if this unrest continues and that is the best it can do. Some of that might be blamed on the holiday here in the US but I am not so sure about that; not with the other markets moving so strongly. Someone was paying attention that is for sure.
The US equity markets were closed along with the rest of the main US markets, but the electronic trade was open in the futures pit as well and based on that performance, US stocks did not like what they saw of the increased chaos in the middle East with the emini S&P down rather sharply during the day. It will be interesting to see how it fares on the reopen of trade later.
As a side note, I cannot thing of any other region on the face of this earth which is so closely tied to two single words, "chaos", and "unrest". It just seems that this part of the globe can never escape this.
Gasoline prices, which have been seemingly unaffected by the recent relative weakness in WTI, exploded through overhead chart resistance near the $2.55 level in the electronic trading session today. Fueled by unrest across the middle East, the entire energy sector shot sharply higher in the thin conditions.
If this market holds onto its gains tomorrow when the full trading contingent will return, it looks like we are going to have another commodity market catching fire further fueling the coming surge in inflation. Food and energy - the essentials of life - are now all rising together.
It puts me in remembrance of a scene from the movie, "Rocky 3" where the sports announcer is asking Rocky's opponent, Clubber Lang, about his prediction for the match between he and Rocky.
Clubber responds by repeating the word, "Prediction".
and then adds, " PAIN".
Dear friends:
I posted a reply to some questions regarding this from some of the folks who had read my article on a Commercial Signal Failure but I suspect it got lost in the list.
I thought it best therefore to go ahead and post it up here to make it a bit easier for folks.
There are no limits on gold and silver trading as far as how much the price can move during any trading session.
The purpose of a price limit is to attempt to "cool down" a market that is either collapsing or soaring with the main idea being that it gives traders a chance to reflect a bit more on the news development or event that might have triggered a move of that extent. We traders tend to be a knee-jerk, reflexive type and will move quickly when something occurs that is either very bullish or very bearish. Sometimes, however, after we get a chance to think through the news development, we realize that we overreacted. That allows us to "correct" the price movement of the previous day and restore a bit more balance to a market. If not for this "cooling off" period, price might tend to make too much of an exaggerated move unnecessarily creating havoc among hedgers and some speculators.
However, when a news event, a crop forecast, a geopolitical development occurs that can affect a market, such as the grains for example, and this development greatly alters the supply/demand equilibrium, the markets can trade limit up or limit down several days in a row. When this happens, the exchanges typically have a set of rules that gradually increase the extent to which a price may move before it can no longer trade above or below that level during that session. This is to facilitate trade so that the market can actually function and allow some exiting of positions. A market that has too small of a price limit can and will lock limit bid or limit offer and simply will not trade at all.
A perfect example of this has been the cotton market which is in itself has been experiencing a type of commercial signal failure right now. It has been trading on expanded price limits quite often over the last few months.
Generally, once the price no longer locks limit bid or limit offer, and price begins to trade freely once again, the exchanges will then take another look at the contract and determine when to reduce the price limits as they attempt to bring them back towards the original defined move limit.
This lack of a daily price limit is also one of the reasons that speculators in the precious metals need to be careful. Those things can move a very long way and keep on going and if you are on the wrong side and do not employ good money management techniques, you can easily get wiped out in a hurry.
Watch out for complacency and overconfidence. They are killers!