Saturday, April 30, 2011
Friday, April 29, 2011
The Saddest Commentary I know of on the United States of America; Requiescat in Pace
The Dollar's Tombstone should be engraved with not only the above words, but with an addendum carved below that stating:
"MURDERED by THE FEDERAL RESERVE" in cooperation with the imbeciles who held public office at that time of its demise.

"MURDERED by THE FEDERAL RESERVE" in cooperation with the imbeciles who held public office at that time of its demise.

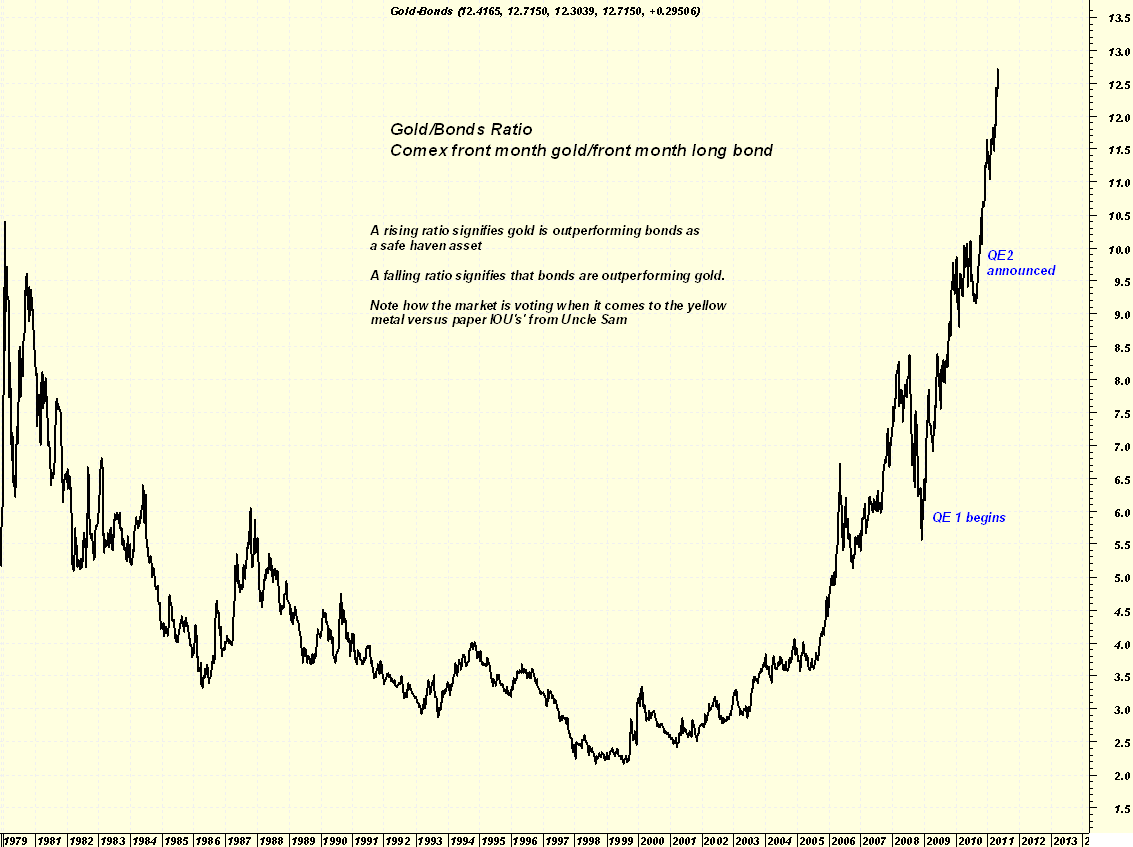
Gold versus US bonds - not even close!
Even though the Fed continues to rig and manipulate the US Bond market, artificially distorting long term interest rates in the name of "saving the economy" ( who will save us from the Fed?), the fact is that the US long bond has been a gigantic DAWG when it comes to the smart place to put one's wealth to preserve its value.
Watching the day to day gyrations in the US bond market and the mockery that the Fed has turned it into, I sometimes wonder who in their right mind would even consider putting their wealth into these worthless scraps of paper IOU's or regard them as a safe haven. AS a matter of fact, I cannot bring my mouth to utter the two things together in one single breath - "US Treasury" - "Safe Haven" - without a feeling of total revulsion coming across me.
While the Fed may have hoodwinked some investors into believing that they have placed their money into a safe haven where they may find a store of value, gold is not buying into that claptrap for one single moment.
Just look at the ratio comparing the two and note how gold has left the US long bond in the dust. Now, looking over this chart, which one do you think a wise investor should choose? Or perhaps a less charitable way of saying it: "Who is stupid enough to buy pieces of confetti paper promises to pay when the Federal government is spitting them up like hairballs from a long-haired Persian cat?" The more I think about this, the more I am convinced that the hairballs have more appeal - at least they are healthy for the cat to get rid of out of its system. What can be said about US debt obligations???
SLV running up Enormous Volume
It seems as if Silver has caught the attention of the trading/investing public in a significant way based on the enormous volumes being recorded in both the Comex silver market and the IShares Silver Trust or SLV.
The volume in the Comex, especially on Monday, was so large that I initially thought it was a typo and would be corrected by the exchange. It was not. That day the volume of contracts traded hit a whopping 319,000!
Not to be outdone, SLV registered a volume of nearly 190 MILLION shares. To give you an entire of how massive this was, consider that an average daily volume comes in near 35 - 40 million with an occasionally busy day hitting closer to 50 million.

I find this especially disconcerting as it tells me that there is the potential for a lot of froth forming in the market. Please understand, this is not to say that the bull run in silver is over; far from it, as I fully expect silver to trade closer to $100 before all is said and done, particularly if the Dollar drops below 68 on the USDX. However, with volume this large and so much interest in owning the metal, it might need to take a bit of a breather before moving higher into a new upleg.
That would provide a lot of bulls who are nervous about buying at these levels an opportunity to acquire more of the metal at a better price. Rignt now the metal is unable to move past $50 - that means if a trader buys in now at these levels, he has the potential to make perhaps $1.50 on the trade before it stalls out again while the potential for the market to fall as low as $45 exists, a drop of some $3.00 or so from current levels. That is a risk/reward level of 1:2 to the downside. Those are not good trading odds which is why we are seeing some speculators selling up near $50. They want to see the price clear this level before feeling comfortable coming back in on the buy side up here.
Should the market move lower and especially if it were to for some reason take out $45 on the downside, the risk/reward ratio begins to improve tremendously. Would-be longs will then we looking for an entry point once they feel that the market has established a decent base of support from which to move higher.
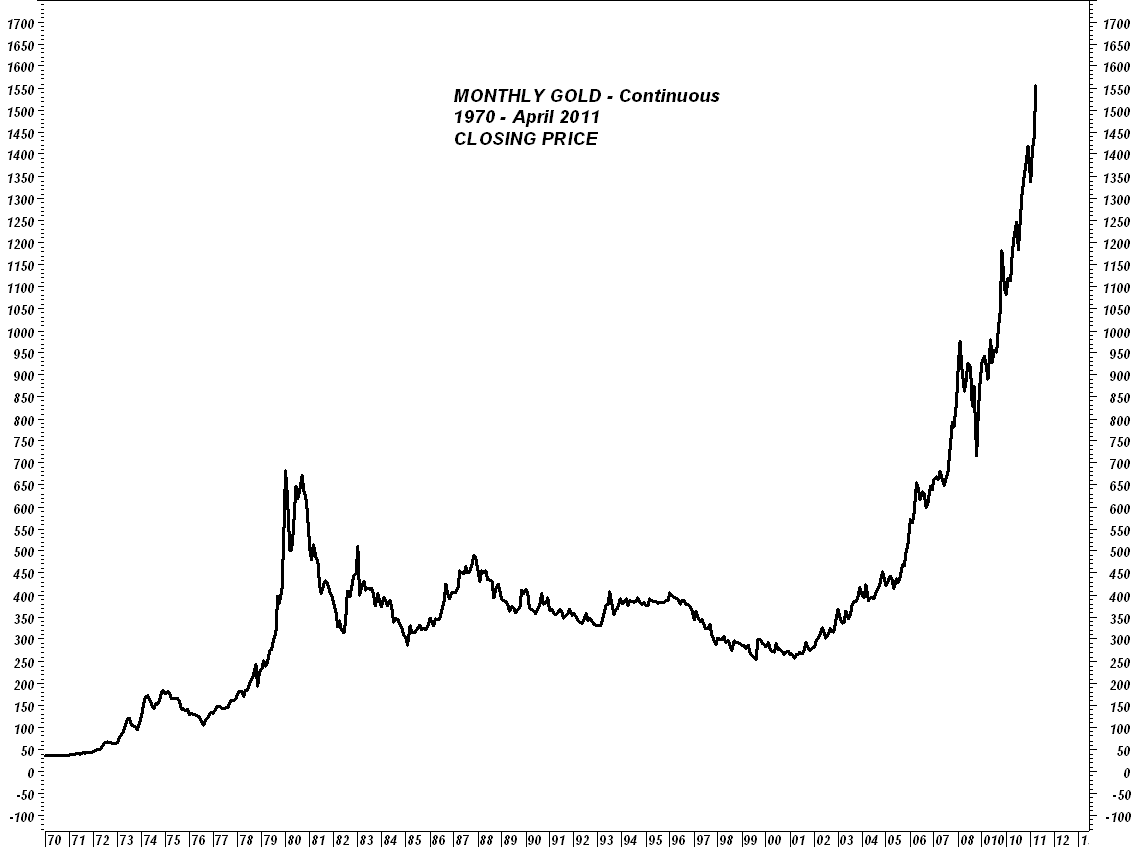
Monthly Gold Charts - April 2011
Gold put in a stunning performance for the month of April taking on $117 for a gain of over 8%.

The following chart is an inflation adjusted chart using the government's official CPI numbers ( not that they are any good but they at least serve to give us a view of where the metal should be priced if it kept up with even those fairy tale figures). I should note here that as a general principle, once a market takes out a 75% Fibonacci retracement level, it almost inevitably recaptures the entire move from whence the calculation began. In plain speech, that means gold is now firmly on target to reach at least $1750.


SILVER Commitment of Traders Report
The CFTC COT data released this afternoon confirms what the daily exchange data has been telling us - open interest is declining as price moves higher due to short covering on the part of the commercial/swap dealer categories and long liquidation from managed money.
The data can lead to erroneous conclusions however from those who are not all that well versed in interpretting it however. Because the data covers the period from Tuesday to Tuesday, it picked up the huge spike higher towards $50 in Asian trading this past Sunday evening. It also caught the spike lower from off of that level which resulted in a drop all the way down below $45. That was a price swing of nearly $5.00 in less than two days' time. It was during that swing lower that the commercials were covering shorts.
What appears to be happening at this point is that we are getting commercial and swap dealer short covering on any intraday price dips in the market with managed money selling whenever the price moves higher towards $50. In other words, large specs are selling the rally toward $50 while commercials are buying the dips towards $45 to cover shorts. As long as this occurs, $50 will hold fast and will not be breached. It will take a change in psychology for managed money to be willing to buy silver up near and then above $50. If that occurs, the price will move towards $55.

The flip side to this is that $45 should hold on any downside moves provided this commercial short covering is maintained. If they pull in their bids, price will not be able to hold support near $45 and then we will see more significant selling, this time from speculators who are forced out selling into the weakness. Such an event will be tied somewhat to the substantial hike in margin requirements imposed by the CME Group since it will not take much of a move lower to completely wipe out the entirety of the margin required for one single silver contract. This is where the small speculator becomes quite vulnerable as they have a rather sizeable net long position in this market.
Here is the scenario - as long as price moves higher, the margin hike will not affect the small specs because their long positions will be in the money and it will not become an issue. When it does become an issue however is when prices fall and trigger stop loss selling which cascades. Then paper drawdowns or losses mount quickly and margin calls go out to the smaller specs who go underwater.
Next week will be key to where we go next as far as whether we get a new leg higher through $50 or we set back to first test support down near $45 provided the gap region between $47.15 - $46.70 fails to hold on the test lower.
Significant short covering has been occuring in Silver
Please see the comments on the chart below as this drop in open interest is a reason for a bit of caution in approaching this market. As long as the shorts cover, prices will move higher but one has to be careful to watch for when they might finish up covering.
A push through $50 will force more of this short covering and should attract more buying from the general public but the managed money is still a net seller for the last four weeks. Again - caution is warranted especially with the big hike in margins.

A push through $50 will force more of this short covering and should attract more buying from the general public but the managed money is still a net seller for the last four weeks. Again - caution is warranted especially with the big hike in margins.


Silver knocking on the door of $50 again
The market has rallied strongly since the comments from Fed Chairman Bernanke and the press release of the FOMC but has not been able to move above $50. It will need to do so rather soon or it does run the risk of stalling out here and setting back as some longs will get disappointed and book profits, particularly if the silver mining shares do not perk up soon.

Thursday, April 28, 2011
CMEGroup hiking Silver margins for the second time in a week
The CMEGroup announced that as of the close of trading this Friday, margin requirements are yet again going up in silver.
For speculators, initial margin is increased to $14,513 per full sized silver contract, up from this week's earlier hike to $12,825.
Maintenance margin is moving up to $10,750 from $9,500.
Hedgers margin and maintenance is rising to $10,750 and $9,500 respectively.
For speculators, initial margin is increased to $14,513 per full sized silver contract, up from this week's earlier hike to $12,825.
Maintenance margin is moving up to $10,750 from $9,500.
Hedgers margin and maintenance is rising to $10,750 and $9,500 respectively.
Wednesday, April 27, 2011

FOMC gives Precious Metals Bulls reasons for cheer
The market has obviously interpreted the FOMC news and the comments from Fed Chairman Bernanke as a signal that they are unconcerned about the effect of their policy on the US Dollar, which is sinking further into the abyss. This has traders and investors moving strongly into the gold and silver markets, with gold soaring into a new all time high in nominal terms and silver shooting up a whopping 5%.
Meanwhile, the Dollar has now convincingly broken down below critical chart support near 74 on the USDX and looks on target to sink as low as 72. I have said it several times here on this site and over at jsmineset - if the Dollar breaks down below 72 on that chart and cannot recover that level within a couple of sessions, we will be witnessing the historic demise of the currency and the probable end of its role as the global reserve currency.
Thanks Ben and thanks to all the Fed governors whose foolish, inept, and short-sighted idiocy has set this nation on a path that will make the IMF prediction of its sliding into second place behind China, indeed come to pass. No nation ever kept its place of economic ascendancy by deliberately killing its own currency. An economically strong nation, with a solid manufacturing sector, the rule of law, an ethic of thrift, low taxes, reasonable regulation, etc, will by default have a strong currency.
The plight of the Dollar is now a commentary on the decline of our beloved nation. It speaks with a more pure voice than any analyst could ever aspire to and what it is crying is disheartening to an extreme for those with ears to hear it.
History has the advantage of being relatively objective in its analysis as it is removed from the passions of the era. It is with that in mind that I can confidently say it will render a harsh and severe criticism of those who led our nation and its monetary policy during this period as they presided over its decline.


Tuesday, April 26, 2011


Silver - 8 hour chart update
Based on open interest numbers from yesterday's price action, we had a significant number of fresh short positions instituted in Silver on its run towards $50. Combined with record volume ( a mind boggling 319,024 ) it looks like we had a blow off top in silver for the time being. That high near $49.80 will now serve as the new resistance level beyond which silver is going to have to move before we can get a fresh leg higher in this market.
The market is now in the process of probing lower seeking to uncover support. Precisely at what level that will arise is unclear. It has found a bit of a respite from the selling near $44.60 but that looks fairly flimsy at this point. More substantial support lies closer to $43.50. Beyond that it looks as if $42 will be the next level.
To have a shot at making another run towards its recent peak, silver will have to close above $47.25, or the gap left from its Sunday evening open.

Monday, April 25, 2011
Wall Street Journal Editorial calls for a Return to a Gold Standard
The Wall Street Journal is in exceptionally fine form in Tuesday's edition. The headline from the commentary says it all:
Monetary Reform: The Key to Spending Restraint
This is no small development. Although it does not reflect the view of the editors of the paper itself, since it is an editorial written by a Mr. Lehrman, of the Lehrman Institute, I find it extremely noteworthy that an article calling for a return to a gold standard would actually grace the pages of that prestigious leading financial newspaper. The WSJ is not a "Wild West" newspaper but is an establishment periodical, which is why I was quite surprised to see an article of this nature.
Perhaps the paper will find room to allow for some other writer to make a case against a gold convertibility statute, but for now this just goes to show that the debt crisis that is engulfing our nation is resulting in serious discussion about the role of gold in any future monetary system or in the current system.
My own personal view is that the first nation to do so will end up being the winner as its currency will be the strongest, assuming of course it takes the necessary steps to get its financial house in order.
The author correctly notes the following:
Unrestricted convertibility of the dollar to gold at the statutory price restricts Federal Reserve creation of excess dollars and the inflation caused by Fed financing of the deficit".
I urge you to read the entire commentary which can be found here.
http://online.wsj.com/article/SB10001424052748703983704576277431813826152.html?mod=WSJ_Opinion_LEFTTopOpinion
Also, additional information about the Lehrman Institute can be found here:
http://www.lehrmaninstitute.org/lehrman/index.html
Also, while you are at the Wall Street Journal's site, make a special point of reading the exceptionally fine commentary entitled:
Hat's off to the editors of the Journal for presenting such excellent articles on their site. Now if only we had political leaders who understood these things and who were true statesmen willing to heed the advice offered here. Perhaps our nation would have some hope that we can still rise out of the ash heap being created by our current crop of leaders who cannot stop spending this nation to its ruin and who indeed allow the Federal Reserve to deliberately debauch and thus ruin our national heritage, the Dollar.
Monetary Reform: The Key to Spending Restraint
This is no small development. Although it does not reflect the view of the editors of the paper itself, since it is an editorial written by a Mr. Lehrman, of the Lehrman Institute, I find it extremely noteworthy that an article calling for a return to a gold standard would actually grace the pages of that prestigious leading financial newspaper. The WSJ is not a "Wild West" newspaper but is an establishment periodical, which is why I was quite surprised to see an article of this nature.
Perhaps the paper will find room to allow for some other writer to make a case against a gold convertibility statute, but for now this just goes to show that the debt crisis that is engulfing our nation is resulting in serious discussion about the role of gold in any future monetary system or in the current system.
My own personal view is that the first nation to do so will end up being the winner as its currency will be the strongest, assuming of course it takes the necessary steps to get its financial house in order.
The author correctly notes the following:
Unrestricted convertibility of the dollar to gold at the statutory price restricts Federal Reserve creation of excess dollars and the inflation caused by Fed financing of the deficit".
I urge you to read the entire commentary which can be found here.
http://online.wsj.com/article/SB10001424052748703983704576277431813826152.html?mod=WSJ_Opinion_LEFTTopOpinion
Also, additional information about the Lehrman Institute can be found here:
http://www.lehrmaninstitute.org/lehrman/index.html
Also, while you are at the Wall Street Journal's site, make a special point of reading the exceptionally fine commentary entitled:
Bernanke's Inflation Paradox
The Fed said it wanted higher prices. Voila!
http://online.wsj.com/article/SB10001424052748704677404576285021008297758.html?mod=WSJ_Opinion_LEADTopHat's off to the editors of the Journal for presenting such excellent articles on their site. Now if only we had political leaders who understood these things and who were true statesmen willing to heed the advice offered here. Perhaps our nation would have some hope that we can still rise out of the ash heap being created by our current crop of leaders who cannot stop spending this nation to its ruin and who indeed allow the Federal Reserve to deliberately debauch and thus ruin our national heritage, the Dollar.
CME Group hikes margin requirements for Silver
After the extreme volatility in silver, it comes as no surprise to see the CMEGroup raise margin requirements for trading silver yet again.
Speculators now need to pony up $12,825 to buy or sell a single full sized silver contract - that is up from $11,745. Maintenance margin now rises to $9,500 from $8,700.
Some of what you are witnessing this evening in silver is due to this change being instituted as brokers are calling clients advising them of the coming change at the end of trading tomorrow (Tuesday).
Emini silver and miNY silver futures are also affected by this change.
Hedgers' margin requirements are being increased to $9,500 from $8,700. Wouldn't it be nice to get hedger margins when the truth is that much of what occurs at the Comex is not hedging but is pure speculation on the part of the perma bear firms.

Silver - 8 hour chart update
The chart shows a very large volume spike on the big down candle suggesting the presence of long liquidation in a large way as many bulls rang the register once it appeared that the market was not going to take out $50. It is however a bit tricky reading this because we are also now into rollover activity where traders begin moving positions out of the May contract, which will soon be going into delivery, and into the July, which will then become the most active contract. Some of that activity tends to distort the overall volume readings. Nonetheless, the big volume down day is technically significant.
Open interest in the July is now larger than the May by the way so I will soon be shifting my analysis to that contract once its volume exceeds that of the May.
I should note two significant occurrences here. First of all, there STILL IS NOT SHORT COVERING on a large scale occuring in silver based on the continued increases in open interest as the price moves higher. There may be a short in trouble but there seems to be more than enough NEW SHORTS who are willing to stand in front of this market who are not afraid of either adding on to their existing shorts or putting on a fresh new short position. I continue to find that remarkable given the size of the paper losses that the bears have been enduring. The entity involved seems to have an unlimited wallet.
The second occurrence is that silver has not yet exceeded its all time high made way back in 1979 even after its spike higher in overnight trading in Asia on Sunday night.
We now need to see where the market will base after this big move up and then back down. The gap from overnight was filled in New York trading, less than 24 hours after it was formed. That is too soon to be a breakaway gap meaning it looks more like an exhaustion gap. I should point out however that generally, exhaustion gaps are preceded by breakaway gaps. We have not had even one of those occur this year.
The way I am reading this is that on the daily chart we show a spinning top formation meaning that a temporary top is in the silver market but since I have not seen any short covering of significance over the last week and since there was no breakaway gap evident on the way up, I am extremely hesitant to say this move is over to the upside or that silver will now collapse as some suggest is what normally occurs after a parabolic move.
We can definitely set back some from here but I am more inclined to look for the market to establish a new base of support instead of collapsing as some might be suggesting. What we will need to do is to allow the market to show us where this support will emerge. Currently the chart shows initial support near $46 followed by a band near $44.00 - $43.50. Let's see how things go from here.
If it is going to renew its move higher, it will need to clear $50 and hold that level on any move back.
One thing is for certain however - if the Dollar takes out 74 and cannot recover that level, silver, and gold, are both going back up.


Any questions as to why Gasoline is over $4.00 and rising
Don't worry however - Obama is going to launch a task force to get to the bottom of these high gasoline prices which are no doubt entirely the cause of evil speculators.
Energy in America: EPA Rules Force Shell to Abandon Oil Drilling Plans
| FoxNews.com
IMF predicts America's Fall from Number One
There are many reasons for this but in my view the primary causes are the fools in Washington DC who spent us into the toilet using borrowed money to do so and who then had their puppet at the Federal Reserve print gazillions of Dollars into existence thereby assuring its debasement.
The combination assures us that the next two generations will be saddled with a debt burden, not of their own making, which will never be repaid in its original form.
I might also add the role of a large portion of the citizenry who seem to think that they are entitled to the fruits of the labors of others and who continue to vote for the very same type of politicians who are ensuring our decline.
Then again, you can also thank those who made it so difficult to own and operate a business here in the US between excessive regulation and overbearing bureaucrats that entrepreneurs threw up their hands in disgust and just moved their operations overseas.
You can read the entire story here ( it will undoubtedly deeply grieve you if you love this nation) :
http://www.marketwatch.com/story/imf-bombshell-age-of-america-about-to-end-2011-04-25?link=MW_home_latest_news
The combination assures us that the next two generations will be saddled with a debt burden, not of their own making, which will never be repaid in its original form.
I might also add the role of a large portion of the citizenry who seem to think that they are entitled to the fruits of the labors of others and who continue to vote for the very same type of politicians who are ensuring our decline.
Then again, you can also thank those who made it so difficult to own and operate a business here in the US between excessive regulation and overbearing bureaucrats that entrepreneurs threw up their hands in disgust and just moved their operations overseas.
April 25, 2011, 8:57 a.m. EDT
IMF bombshell: Age of America nears end
Commentary: China’s economy will surpass the U.S. in 2016
You can read the entire story here ( it will undoubtedly deeply grieve you if you love this nation) :
http://www.marketwatch.com/story/imf-bombshell-age-of-america-about-to-end-2011-04-25?link=MW_home_latest_news
Sunday, April 24, 2011
Silver reaches within 20 cents of $50
Silver is on fire in Asian trading this evening moving to a session high of $49.82 after which is rapidly dropped a full $1.00 in price before bouncing back over $49 again. It is extremely volatile right now and I mean "VOLATILE". The price is swinging all over the place within mere seconds.
Its strength is helping to pull Gold higher as well which has gone on to hit a new all time high at $1518.40 as I write this.
What is remarkable about this is that the Dollar is actually higher this evening in Asian trade.

Its strength is helping to pull Gold higher as well which has gone on to hit a new all time high at $1518.40 as I write this.
What is remarkable about this is that the Dollar is actually higher this evening in Asian trade.

Saturday, April 23, 2011
Trader Dan on King World News Weekly Metals Wrap
Please click here to listen to my regular weekly radio interview with Eric King of King World News on the Weekly Metals' Wrap.

Thursday, April 21, 2011
A BRIEF CONSIDERATION OF SILVER'S OPEN INTEREST
Time permitting, I hope to have more on this later but wanted to throw a brief comment or two about silver's rocket move higher.
This has been a strange market to read with what I consider to be confusing CFTC COT reports and various changes in the daily open interest as well as all manner of rumors surrounding the delivery process. If I had nothing to go on but price action, I would say that a large short or shorts are in serious trouble and are attempting to get out but are not being allowed to by some very big and committed buyers who are going after them. I have seen enough cornered shorts being hounded by wolves who smell blood in the water during my trading career to be fairly confident that this is behind some of the price action in silver.

However, based strictly on the changes in open interest it is unclear if this is actually occuring. The sharp push from $34 to $42 was accompanied by a rather sizeable increase in open interest indicating that it was not primarily driven by short covering. If anything, fresh shorts were piling in, each of them attempting to pick a top or with other purposes in mind and kept on coming in as silver moved an incredible $8 higher in less than a month's time.
From $42 to $44 there was short covering occuring as some of the shorts were throwing in the towel and giving up leaving a lot of blood on the floor of the pit as they departed. However, once again the open interest has stabilized and actually ticked up some Wednesday as price soared above $45. Clearly some new shorting is occuring as top pickers are once again trying to strike what they think is paydirt. I am especially eager to see the numbers from today's sharp push through $46.
At some point the top pickers are going to get it right but as long as they keep coming in and the determined buyers keep showing up, we should see more bouts of this sort of change in open interest - namely - it increases as these fresh shorts take on the new buyers only to see the same shorts run for cover and close out their short positions with large losses as the market buying pressure forces them out. The process can then repeat with open interest rising and then subsequently falling and then repeating again.
If we do indeed get a serious short squeeze, and I mean one in which we see a total capitulation of the large short that has ruled this market for many years previously, we are not going to see any increases in open interest but rather a sharp fall in the total OI as they finally and completely give up. Whether that happens is anyone's guess. I would have thought it would already have commenced seeing the enormority of the paper losses that are accruing to those on the short side of this market. The margin calls and the need to constantly raise more cash to maintain these deeply underwater short positions must boggle the mind at this point. Just the run from $34 to $42 was a loss of $40,000 per single contract! Imagine holding hundreds if not thousands of these!
Having been on the wrong side of a market at various times in my career I can tell you from firsthand experience, the emotions that one deals with run the gamut from fear to despair to panic and total desperation. It is a horrid thing to live through mainly because the losses mount at such a rapid clip. What makes matters worse is that you keep waiting for a setback in price, any setback, to try to buy back those shorts and it never seems to come. Prices just keep going up and up and up and up. You learn very quickly the terrible, awful power of leverage gone awry.
We will just have to wait and see how this all ends but for now, with so many apparently eager top pickers coming in, it is difficult to say that this thing has run out of upside just yet. They are providing the firepower to take it higher as they are forced into buying it all back at a higher level and taking their losses with them. Perhaps when we see an end to efforts to pick a top, this thing will actually top out. Either way, it has been one helluva ride already. The thing is that if you look at silver in inflation adjusted terms, the gray metal is still cheap by comparison to where it was in late 1979, early 1980.
US Dollar posts the lowest Weekly Close in 32 Months
Not much more needs to be said about the US Dollar than this headline. They managed to push it just barely above the support level ahead of the long holiday weekend but it certainly looks weak heading into next week. The problem is even though the "short Dollar" trade is crowded, there does not yet exist a fundamental reason to buy the Greenback.
That bodes poorly moving forward, oversold, crowded or extreme bearish sentiment notwithstanding.

That bodes poorly moving forward, oversold, crowded or extreme bearish sentiment notwithstanding.

CMEGroup (Nymex and Comex) markets closed for trading tomorrow
Gold and silver will not be trading on the Comex tomorrow in observance of the upcoming Easter Holiday according to the CME press release. They will reopen Sunday evening.
Thursday, Apr 21
NYMEX & COMEX® and DME Products on CME Globex 1615 CT / 1715 ET – Regular CME Globex close for trade date Thursday, Apr 21
Friday, Apr 22 CME Globex is closed
Sunday, Apr 24 1700 CT / 1800 ET – Regular CME Globex open for trade date Monday, Apr 25
Thursday, Apr 21
NYMEX & COMEX® and DME Products on CME Globex 1615 CT / 1715 ET – Regular CME Globex close for trade date Thursday, Apr 21
Friday, Apr 22 CME Globex is closed
Sunday, Apr 24 1700 CT / 1800 ET – Regular CME Globex open for trade date Monday, Apr 25
Silver - 30 Minute chart
Here is a 30 minute chart of Silver noting the current support and resistance levels at this time.
A push through the region near $46.25 should let it run towards $47. A breach of $45.50 would imply a drop towards $45.10.

A push through the region near $46.25 should let it run towards $47. A breach of $45.50 would imply a drop towards $45.10.

Wednesday, April 20, 2011
The US BOND market has become the most important market on the Planet
It is my opinion that out of all the markets that the monetary officials are keenly interested in, some to the point of tinkering with constantly, no one market has become more important to them than the US Treasury market. Not even the Dollar has them as extremely on edge as the long bond in particular.
The reason for this is twofold. First of all, since the Fed is engaging in QE2, they cannot afford to allow the bond market to break down technically on the price charts. That would send a signal to every single hedge fund computer algorithm in existence to slam this market down sharply lower. The resultant rise in long term interest rates would choke off the economic "recovery" and would utterly and hopelessly short circuit the very reason for their massive purchases of Treasuries, purchases which I might add have resulted in their balance sheet holding more Treasury paper than the total reported holdings of China.
Second is the massive US federal debt level, a level which is looking increasingly like one associated with a banana republic. The cost of servicing the interest alone on this debt ratchets up with alarming rapidity with each and every tick higher in interest rates. As more and more new debt is issued, it then comes with a higher price tag for the federal government. A sinking bond market would compound this inescapable problem and add an entirely new dimension to the crisis.
That is what must keep monetary policy planners as well as fiscal policy planners awake at night and why so much attention is fixated on the bond market. It is also the reason that whenever any of the Fed governors sound a hawkish note on the US economy, Bernanke and the rest of the doves on the Board are so quick to counter. Their comments always serve to rescue the bond market from any potential sell offs.
Take a look at the following chart and note the nearly perfect correlation between the price action in the broader equity markets as illustrated by the S&P 500 chart and that of the long bond. The area within the rectangle is what I would like you to focus on. Note also the level of the S&P at its recent peak near 1340 and the level of the bond at that time, which had a 117 handle on it.
Now move to the right of the chart to see today's closing price on both. The S&P is a mere 14 points off its recent high and yet we see the bonds sitting with a handle of 121, fully 4 points higher than the last time we were anywhere near 1344 on the S&P.

Combine this print on the bonds with the fact that the Continuous Commodity Index ( CCI ) put in an ALL TIME HIGH today with strength seen in the surging energy and precious metals markets, and one can see just how greatly the Federal Reserve has DISTORTED the interest rate markets in the US.
What they are attempting to do (and succeeding I might add) is to camoflauge or better yet, counterfeit, the message being generated by the bond market. They are duplicitly masking the inflationary results of their policy of QE.
I might add that if this were not fradulent enough, it also comes on the heels of a stunning downgrade of the US credit outlook by the ratings agency Standard and Poor. Imaging this even being possibly contemplated a decade ago!
In the face of a falling dollar, a US credit outlook downgrade, a surging stock market, and soaring commodity prices, the bond market, thanks to the interference by the Federal Reserve is telling us all that the only thing we need to fear is fear itself.
History is going to record this sham and I trust will not deal kindly with those who have perpetrated this fraud upon the American citizenry.
This will not end well.
Tell me that Political Leaders don't put pressure on Ratings Agencies
Fox News is reporting a story that contributes further towards my cynicism towards political leaders, manely that the Obama Administration was pressuring the ratings agency S&P, not to downgrade the credit outlook for the US government as they did from "stable" to "negative".
Here is the headline:
I find this particular galling giving the fact these reckless spenders have created a situation in which the US Dollar is sinking under the weight of this massive debt load and continued monetary policy foolishness. Instead of wasting time twisting the arms of the rating agency, which is finally doing what it should be doing and sounding an appropriate warning, these people who help create this unmitigated disaster should be doing what responsible statesmen should be doing, namely stop spending the damn money that they do not have.
The more stories like this surface, the worse the light it puts the US government in and the more it leads to skepticism that anything will be done to address the most monumental issue of our day.
You can read the entire story here:
http://www.foxnews.com/politics/2011/04/20/obama-officials-tried-convince-sp-issue-credit-warning/
Here is the headline:
Obama Officials Tried to Convince S&P Not to Issue Credit Warning
Published April 20, 2011
| FoxNews.com
The more stories like this surface, the worse the light it puts the US government in and the more it leads to skepticism that anything will be done to address the most monumental issue of our day.
You can read the entire story here:
http://www.foxnews.com/politics/2011/04/20/obama-officials-tried-convince-sp-issue-credit-warning/
Silver blows through Resistance at $44
The silver market is now entering a parabolic phase, a phase that while it can bring enormous profits for those who are long, is also extremely dangerous for traders. Markets in this phase can generate price swings in either direction that will wrench on the gut and turn euphoria into near panic.
The breach of $44 was impressive enough but the fact that it has easily taken out $45 with relative ease suggests this market is on course for a run to $50. The rate of ascent could take it there by early next week but at some point, there will be a rush to ring the cash register. Just know that those who want to trade this mad market, had better be prepared for what they are getting themselves into.
What makes trading a market of this nature so difficult is attempting to place money management stops or at least mental stops. The extent of the price swings are so huge that stops placed too close to the last trade are prone to be taken out in a price retracement which then quickly ends only to see the uptrend resume leaving the trader sitting on the sidelines watching as he misses the rest of the ride higher. Place a stop too far away from the last price and it could wipe out one's margin before it gets triggered. In other words, attempting to set a risk parameter for the trade if it goes sour becomes almost impossible for all but those with very deep pockets whose accounts are well funded.

Volume has picked up on the breach of $44 as expected which has alleviated the concerns I expressed here yesterday as it seemed to be floating higher instead of being driven higher as it is in the process of being done today. I still see a very real fear among would-be shorts to step in front of this thing. A market making moves of 2-3% day after day is primed for a correction but no one wants to jump on the tracks in front of the freight train.
The gold/silver ratio continues to drop in favor of silver and is currently near 33.16 as I write this. It was down below 20 in late 79, early 1980. Could it go this low again? Yes, it could.
US DOLLAR very close to an accelerating decline
There is only one way to describe what is occuring to the US Dollar; its future as the global reserve currency is in serious danger of disappearing forever. Under the "leadership" of the US Federal Reserve, and thanks also to the reckless and incredibly short-sighted spending occuring at the Federal level, the Dollar has run out of friends.
It's decline this morning has opened the door for gold to push past $1500 and silver into what looks to me like the beginning of a "MELT UP" mode. It has also send further speculative money flows into the commodity sector with the result that the CCI, the Continuous Commodity Index, is within a whisker of matching its all time high.
What many of us have feared could happen but were hoping to see avoided, is becoming increasingly likely the further the Dollar descends into this abyss. As a citizen of my nation who cares deeply for its future for the sake of my own children, I am both disgusted and grieved at what those who were charged with preserving the integrity of its currency have done to our birthright.
A pox on these scurrilous men who have sold out our nation for political expediency. Their only loyalty is to their own pocketbooks and their crony pals who could give a rat's ass what happens to the nation as long as they can profit from it all. This plague of locusts is stripping us bare.


Tuesday, April 19, 2011


How not to get along with your Banker
China Urges US to Protect Creditors After S&P Warning
Published: Tuesday, 19 Apr 2011 | 10:46 AM ET
By: Reuters
China's Foreign Ministry said on Tuesday that the United States must take "responsible" measures to protect investors in its debt after Standard & Poor's threatened to lower its credit rating on the United States due to a bulging budget deficit.
Read the entire story here:
Silver moving higher on mediocre volume
In watching silver move up towards $44 in today's session, I am struck by the huge amount of air pockets above this market. Based on the manner in which is it moving up, there are simply not enough offers. I get the sense that would-be shorts in silver are terrified to step in front of this market. The dearth of sellers is allowing small bids to take the price up in big steps.
Coming on the heels of what was a huge volume day yesterday, I am a bit concerned about this. Right now it seems to be more a case of fewer sellers than it is a case of more buyers. I want to see the metal clear $44 and hold that level to feel a bit more comfortable about this and I want to see the volume pick up some. This market has come a long way and will need to see plenty of buyers even at these levels to keep it moving steadily upward.
A pause in the move would actually be healthy at this point. It could be that some of the shares are sensing this are a reluctant to jump higher waiting to see if the metal will pause and set back a bit or gather further momentum and just head to $50. Should the latter occur, we will see a rash of short covering in the silver mining shares.
Let's see how the metal fares the remainder of the trading day. If it clears $44, the volume should pick up.

Mining shares need the Man with no name
For a little fun on another day in which the mining shares are once again lagging the metals.
Those of you who are fans of the trilogy from the 60's will remember the scene well!
http://www.youtube.com/watch?v=KaZkv0aorMM&feature=related
And just for your listening pleasure.... A classic soundtrack lead... great music to trade to....
http://www.youtube.com/watch?v=mLXQltR7vUQ&feature=related
http://www.youtube.com/watch?v=CpZjvbSC9_M&feature=related
http://www.youtube.com/watch?v=2PwpOmjAu1M&playnext=1&list=PL5B9214378E620573
Monday, April 18, 2011
Moody's - or - Standard and Poor's?
I have been fielding a few private emails asking about the rather bizarre behavior in the bond market today. After being greeted with a downgrade to the US credit outlook from "stable" to "negative" by S&P, the bonds sold off sharply falling near a full point at their worst level.
They then began moving higher even as the stock market was sharply lower as the rival ratings agency, Moody's issued a positive outlook on its own AAA US rating. Moody's did site some of the same concerns as S&P but suggested that the US government would reach some sort of agreement on dealing with the massive debt problem in contrast to S&P which was not at all confident that leaders would be able to come to any agreement to deal with it.
Moody's also cited issues facing Greece and thus drew some attention off of the US credit issues and back onto Euro sovereign debt issues.
The situation reminds me of the scene from the old movie, "Deliverance", with the dueling banjos. Moody's basically pooh-poohed S&P. My way of thinking is the US citizens are the ones going to be doing the squealing when the dust finally settles - those who saw the movie and remember that one scene will know exactly what I am referring to.
If that was not enough, the US National Association of Home Builders Index revealed that homebuilder optimism in the industry dropped one point in April from 17 to 16. That served to reinforce the notion of a sluggish economic pace of "recovery" in the US calming some concerns about any early end to QE2 as some of the Fed governors were out yacking about once again.
I should note here that the speed at which the long bond market fell tells us just how precarious things are in that market. In my opinion, it is a giant accident just waiting to occur.
Silver flirting with $44
Silver has made an approach to its next resistance level near $44 which it will have to clear to set up a run towards $46. Its prior pattern has been to make an approximate $2 increase, pause, move sideways and consolidate, and then make the next leg higher as it stairsteps its way upward.
I am a bit concerned by the huge volume earlier in the session but that is only because the market has moved so far, so quickly. Also, we are beginning to see an increase in rollover activity which is going to exaggerate volume readings until we get to the first of May so that has to be taken into account as well when we look at these things.

I am a bit concerned by the huge volume earlier in the session but that is only because the market has moved so far, so quickly. Also, we are beginning to see an increase in rollover activity which is going to exaggerate volume readings until we get to the first of May so that has to be taken into account as well when we look at these things.

Gold closes in on $1,500
Gold experienced a strong move higher today as news filtered out over S&P's downgrade to the US credit outlook.
As mentioned in my last Friday radio interview with Eric King on the Weekly Metals Wrap, I did not expect it to breach this level on its first approach. This level has as much significance as $1,000 in the sense that it is psychologically significant. There are traders who had $1500 as an initial target for this leg and it is normal to see them booking profits on the first approach. A setback therefore would not be expected. There are several levels on the chart that should provide some downside technical support should this occur.
If, on the other hand, gold goes right through $1500 without so much as pausing, it will indicate that its price is about to accelerate sharply higher.

HUI so far is holding support
Approximately two weeks ago to this date, the gold and silver mining shares experienced a tremendous wave of short covering along with some new buying. Some of this was an unwind of the short positions established as a spread trade against the metals. After plowing through the 600 level and setting an all time high in the index, the spread trades were reapplied across some company stocks pushing the index back down even in the face of rising metals prices.
If you note on the chart, the index moved back down to the same precise level at which the fierce wave of short covering commenced. It held firmly and moved back up off the level. While it is down, it appears that this level near and just below 570 is solid support in the sector. If that is the case, the shares should hold near current levels.

Let's see what the rest of the session brings us and what tomorrow does as well in regards to these miners.
US downgraded by S&P
Here's something that 10 years ago many of us would not have ever thought was possible: What a terribly sad day for our nation and a commentary on the dangers of debt.
By - Apr 18, 2011 6:20 AM PT
Standard & Poor’s put a “negative” outlook on the U.S. AAA credit rating, citing rising budget deficits and debt.
“We believe there is a material risk that U.S. policy makers might not reach an agreement on how to address medium- and long-term budgetary challenges by 2013,” New York-based S&P said in a report today. “If an agreement is not reached and meaningful implementation does not begin by then, this would in our view render the U.S. fiscal profile meaningfully weaker than that of peer ‘AAA’ sovereigns.”
You can read the entire story here:
http://www.bloomberg.com/news/2011-04-18/standard-poor-s-puts-negative-outlook-on-u-s-aaa-rating.html
Standard & Poor’s Puts ‘Negative’ Outlook on U.S. AAA Rating
By - Apr 18, 2011 6:20 AM PT
Standard & Poor’s put a “negative” outlook on the U.S. AAA credit rating, citing rising budget deficits and debt.
“We believe there is a material risk that U.S. policy makers might not reach an agreement on how to address medium- and long-term budgetary challenges by 2013,” New York-based S&P said in a report today. “If an agreement is not reached and meaningful implementation does not begin by then, this would in our view render the U.S. fiscal profile meaningfully weaker than that of peer ‘AAA’ sovereigns.”
You can read the entire story here:
http://www.bloomberg.com/news/2011-04-18/standard-poor-s-puts-negative-outlook-on-u-s-aaa-rating.html
Sunday, April 17, 2011
SIL (Silver Miners ETF) to Silver ratio
This one is very revealing as it contains silver miners. Its performance against silver since last year has been spectacular - if one can measure a poor showing in those terms (spectacularly poor).
SIL Top Ten Holdings
- Silver Wheaton Corporation (SLW): 12.74%
- Industrias Penoles SAB de CV (PE&OLES): 11.10%
- Fresnillo PLC (FRES): 10.44%
- Pan American Silver Corporation (PAAS): 9.82%
- First Majestic Silver Corp (AG): 6.86%
- Coeur D'Alene Mines Corporation (CDE): 5.64%
- Silvercorp Metals Inc. (SVM): 5.22%
- Hochschild Mining PLC (HOC): 4.45%
- Hecla Mining Company (HL): 4.40%
- Silver Standard Resources, Inc. (SSRI): 4.32%


Thanks to the folks who caught my stupid error
I appreciate the emails and notes from so many who took some time out to write and help me get my head on straight when it comes to interpreting my own chart.
A falling GDX to GDXJ ratio does indeed note that GDX in UNDERPERFORMING the latter. That would mean the opposite is occuring from what I wrote!
Maybe one of these days I will get some sleep and think clearly again. My apologies to the readers and my appreciation for your forebearance.
What the falling ratio would indicate is that the large caps are underperforming against the smaller mid caps and juniors in general.
I am going to leave the former post up as a monument to my denseness. Just flip the analysis around and you will have the right picture. You might also want to focus on some of the stocks I have detailed and compared to silver to get a view of actual company performances against the metal.
I will probably be pressed for time in mentioning this, but if some of you have some particular silver stocks that you want to compare to the performance of the underlying metal send some of the names here and I will attempt to construct the charts so that you get a visual graph of how it is faring.
Thanks again to all
Saturday, April 16, 2011
GDX (majors) versus GDXJ (juniors) Ratio Chart
PLEASE NOTE:
I misinterpreted my own chart when putting together this article and drew an erroneous conclusion. The ratio of GDX to GDXJ indicates whether or not the large caps are outperforming or underperforming the small and mid sized caps (juniors and mid tiers) in general. If this line is falling, it means that the large cap miners are UNDERPERFORMING against the juniors and mid tiers as a general rule of thumb, not as I originally stated in this article below.
I generally field emails from those who are rightly disappointed about the overall performance of some of their gold and silver shares. In nearly every case, the shares that they mention are juniors. That set my mind in a frame that was disposed to look for weakness in the juniors when compared to the majors. As such I incorrectly read my own chart and drew the opposite conclusion to what the actual ratio line indicates. I apologize for this as I should have caught it in the first place.
I should note here that even with this ratio doing what it is doing, many of the juniors are still seriously lagging the performance of the underlying metals. Some juniors and mid tiers have had a stellar performance but many of them are stuck apparently dead in the water. These are the issues that are being leaned on by the hedge funds and it is this which is the source of the constant selling interest that does not seem to let up. Keep in mind however that for every seller, there must be a buyer. Someone is on the other side of the short selling.
The original article now follows:
At the suggestion of my good friend Jim Sinclair, I have prepared a chart detailing the ratio of the price of GDX compared to the price of GDXJ.
The GDX does contain some smaller cap miners but it also mainly includes the large cap mining outfits.
The GDXJ on the other hand, is comprised entirely of medium cap and small cap miners.

Note the steep decline in the line that began in the summer of last year which lasted throughout the remainder of 2010. Only towards the end of last year did the juniors recover a bit of ground but the best they could do was to retrace a small portion of their losses against the large cap miners by moving higher but since January they have gone nowhere against the large caps.
It seems to me that the hedge funds are selectively targeting some of the small and mid tier mining firms to go after with their short side of the spread trade that they have been employing. Perhaps they feel that due to their sheer size and financial firepower, they can overwhelm any buying coming into the smaller firms and thus create an effective put option against their long metals positions. I am not sure but either way, the chart reveals the reason for the frustration among many who own quality junior and mid cap mining firms whose share prices seem stuck in the mud even as the gold and silver markets continue soaring higher.
Let me take this opportunity to also clarify something in my earlier post about the HUI and XAU ratio charts. I did not mean to imply that the mining shares are trading at the same level as they were back in 2001 when silver was $4.00. That is of course preposterous as most have had strong gains over the last decade. The ratio charts' purpose is to show whether the shares are underperforming or outperforming physical gold and/or silver. What the charts do show however is that the mining shares in general have so seriously underperformed the gains in both gold and silver, that the ratio of the indices to the underlying metals is ridiculously skewed. In the case of silver, you have to go all the way back to 2001, a period in which very few people were calling for a major bull run in the metal. There was little if any excitement whatsoever in the mining sector back then.
In regards to silver in particular, the ratio of the HUI and the XAU to it may not be as good of a gauge of how the silver stocks in particular are performing when compared to the price of the bullion, mainly because both indices are dominated by gold producers, particularly the HUI, but both indices do hold silver miners in their basket as well as some gold miners who produce both gold and silver. Since silver has been outperforming gold on a percentage basis, and both of these indices favor a larger number of gold producers than silver, it is reasonable to assume that both of the indices would be lagging silver when a ratio is constructed, but not to this extent. To see these indices trading at such extremely low levels when a ratio is created is indicative of the kind of short selling pressure that is active in the mining sector in many instances.
It is just mindboggling to see how undervalued many of the shares are when compared to the metals. While many have moved strongly higher, a large number of them continue to lag and are not reflecting the kind of price movements that we would expect to normally see with the bullion making either all time highs in price or 30+ year highs.
If you want to get a "fair" or reasonable level at which the indices should be trading, run some statisticial analysis and see what the mean or average value should be then see what the standard deviation away from that mean is. I will leave that to my statistics friends but either way, the result is indicative of how cheap the stocks are compared to the metals in many cases.
Here are a few of the silver stocks comparing them to the price of silver and creating a ratio chart. A rising line indicates the stock price is outperforming the price of silver. A falling line indicates the stock is underperforming.


A pleasant exception: SLW

I misinterpreted my own chart when putting together this article and drew an erroneous conclusion. The ratio of GDX to GDXJ indicates whether or not the large caps are outperforming or underperforming the small and mid sized caps (juniors and mid tiers) in general. If this line is falling, it means that the large cap miners are UNDERPERFORMING against the juniors and mid tiers as a general rule of thumb, not as I originally stated in this article below.
I generally field emails from those who are rightly disappointed about the overall performance of some of their gold and silver shares. In nearly every case, the shares that they mention are juniors. That set my mind in a frame that was disposed to look for weakness in the juniors when compared to the majors. As such I incorrectly read my own chart and drew the opposite conclusion to what the actual ratio line indicates. I apologize for this as I should have caught it in the first place.
I should note here that even with this ratio doing what it is doing, many of the juniors are still seriously lagging the performance of the underlying metals. Some juniors and mid tiers have had a stellar performance but many of them are stuck apparently dead in the water. These are the issues that are being leaned on by the hedge funds and it is this which is the source of the constant selling interest that does not seem to let up. Keep in mind however that for every seller, there must be a buyer. Someone is on the other side of the short selling.
The original article now follows:
At the suggestion of my good friend Jim Sinclair, I have prepared a chart detailing the ratio of the price of GDX compared to the price of GDXJ.
The GDX does contain some smaller cap miners but it also mainly includes the large cap mining outfits.
The GDXJ on the other hand, is comprised entirely of medium cap and small cap miners.
Over 60% of the stocks that make up the GDXJ are Canadian firms. Nearly 14% are US headquartered with 13.31% being Australian. The remaining are from various countries around the globe.
While not a perfect representation, it is a useful tool for charting the underperformance ( in general) of the small and medium cap miners compared to the larger cap miners.

Note the steep decline in the line that began in the summer of last year which lasted throughout the remainder of 2010. Only towards the end of last year did the juniors recover a bit of ground but the best they could do was to retrace a small portion of their losses against the large cap miners by moving higher but since January they have gone nowhere against the large caps.
It seems to me that the hedge funds are selectively targeting some of the small and mid tier mining firms to go after with their short side of the spread trade that they have been employing. Perhaps they feel that due to their sheer size and financial firepower, they can overwhelm any buying coming into the smaller firms and thus create an effective put option against their long metals positions. I am not sure but either way, the chart reveals the reason for the frustration among many who own quality junior and mid cap mining firms whose share prices seem stuck in the mud even as the gold and silver markets continue soaring higher.
Let me take this opportunity to also clarify something in my earlier post about the HUI and XAU ratio charts. I did not mean to imply that the mining shares are trading at the same level as they were back in 2001 when silver was $4.00. That is of course preposterous as most have had strong gains over the last decade. The ratio charts' purpose is to show whether the shares are underperforming or outperforming physical gold and/or silver. What the charts do show however is that the mining shares in general have so seriously underperformed the gains in both gold and silver, that the ratio of the indices to the underlying metals is ridiculously skewed. In the case of silver, you have to go all the way back to 2001, a period in which very few people were calling for a major bull run in the metal. There was little if any excitement whatsoever in the mining sector back then.
In regards to silver in particular, the ratio of the HUI and the XAU to it may not be as good of a gauge of how the silver stocks in particular are performing when compared to the price of the bullion, mainly because both indices are dominated by gold producers, particularly the HUI, but both indices do hold silver miners in their basket as well as some gold miners who produce both gold and silver. Since silver has been outperforming gold on a percentage basis, and both of these indices favor a larger number of gold producers than silver, it is reasonable to assume that both of the indices would be lagging silver when a ratio is constructed, but not to this extent. To see these indices trading at such extremely low levels when a ratio is created is indicative of the kind of short selling pressure that is active in the mining sector in many instances.
It is just mindboggling to see how undervalued many of the shares are when compared to the metals. While many have moved strongly higher, a large number of them continue to lag and are not reflecting the kind of price movements that we would expect to normally see with the bullion making either all time highs in price or 30+ year highs.
If you want to get a "fair" or reasonable level at which the indices should be trading, run some statisticial analysis and see what the mean or average value should be then see what the standard deviation away from that mean is. I will leave that to my statistics friends but either way, the result is indicative of how cheap the stocks are compared to the metals in many cases.
Here are a few of the silver stocks comparing them to the price of silver and creating a ratio chart. A rising line indicates the stock price is outperforming the price of silver. A falling line indicates the stock is underperforming.


A pleasant exception: SLW

Hedge Fund Ratio Spread Trades Continue to Distort the Value of the Mining Shares
I hope to have further on this topic sometime this weekend depending on time constraints but I wanted to at least get some charts up to demonstrate how severely undervalued many of the mining shares are in relation to the underlying metal as a result of the plying of this particular trading strategy.
One of the factors that I believe are involved with this severe underperformance of the shares in general is the advent of the ETF's. Those who want LEVERAGED EXPOSURE to either or both gold and silver can now use the ETF's to do so.
Formerly, there were two methods available - commodity futures or mining shares. Since the charters of some funds prevents them from investing or trading in commodity futures, funds who wanted this leveraged exposure to the metals were forced to go into the mining shares in the past. That implied that bull markets in the metals were going to see substantial money flows coming into the shares.
Since the ETF's came along, those institutions looking for leveraged exposure to gold can now directly purchase the silver or gold ETF's instead and margin those up to obtain leverage. In other words, they are no longer captive to using only the mining shares.
Additionally, the hedge funds, which have proliferated like mushrooms after a summer rain, are able to offer prospective clients exposure to the commodity markets since there is nothing in their charters preventing them from investing in the commodity markets. That attracts further funds that in time past would have flowed into the mining sector directly.
Keep in mind what is necessary to drive prices higher - sustained investment flows. Now, if the investment flows that formerly would be diverted directly to the mining shares have been split and are now moving directly into the commodity futures markets and the ETF's, that pulls a portion away from the shares. That means that there is a bit of an exploitable weakness, a chink in the armor if you will, in the sense that the amount of firepower coming into the shares, is weaker when compared to the other alternative forums for investing in the precious metals.
The hedge funds understanding this then employ a strategy designed to take advantage of the "weaker sister" which suffers somewhat from the smaller money flows heading its direction - they short some of the mining shares while buying the commodity futures and the ETF's. That selling then further absorbs the buying interest that is still heading into the mining sector shares.
The reason they do this is because it helps them manage their risk. When the market sells off in this volatile environment, they are able to profit from the short leg of this trade as the shares head lower generally at a faster rate than the metals themselves do. In other words, they might be losing $1.00 on their long gold or silver positions in the futures or ETF's, but making $1.10 - $1.20 on their short share position. In effect, they have a permanent put option.
This trade has been extremely effective for them which is why they seemingly refuse to give it up but at some point, the effect is to so distort the price of the mining shares in relation to the underlying metal, that something has to snap to bring the share price back in line to historical norms. After all, the higher the metals run in price, the more profitable the well run miners become. Stock prices are eventually determined by profits - Eventually some of the hedge funds plying this trade will begin to realize that they are pushing the trade too far and will begin to exit. That will set off a rush by the others to do the same.
We got a brief taste of this April 5 of this year when the HUI shot up nearly 30 points in a single day. That was the first sign that the days of this trade are drawing to a close. There is an old adage in the trading world which is apropos for this situation:
Bulls make money; Bears make money; but Pigs get slaughtered.
Hedgies beware. The time is coming when there are not going to be any sellers on the other side of your trade when you need to unwind it.


Subscribe to:
Posts (Atom)