The gold price has a nice recovery off of the double bottom near $1180 and in the process, has improved the balances of the long suffering bulls' investment portfolios in the process. Those who failed to heed the charts on the breakdown of support at $1530-$1525 and instead listened to all the perma bulls and their various theories of why the market simply HAD TO GO HIGHER, are finally seeing a respite in the bleeding of their net worth. I am happy for them as some of them are advanced in years ( I Have read their private emails to me) and were incredibly fearful of what these paper losses meant to their retirement plans or their livelihood.
By the way, for some of you folks, I do hope you have learned the painful lesson of being 100% invested in a single sector. Under any circumstances, that is simply not wise. Too many things can occur which none of us can foresee as we are at best mere mortals.
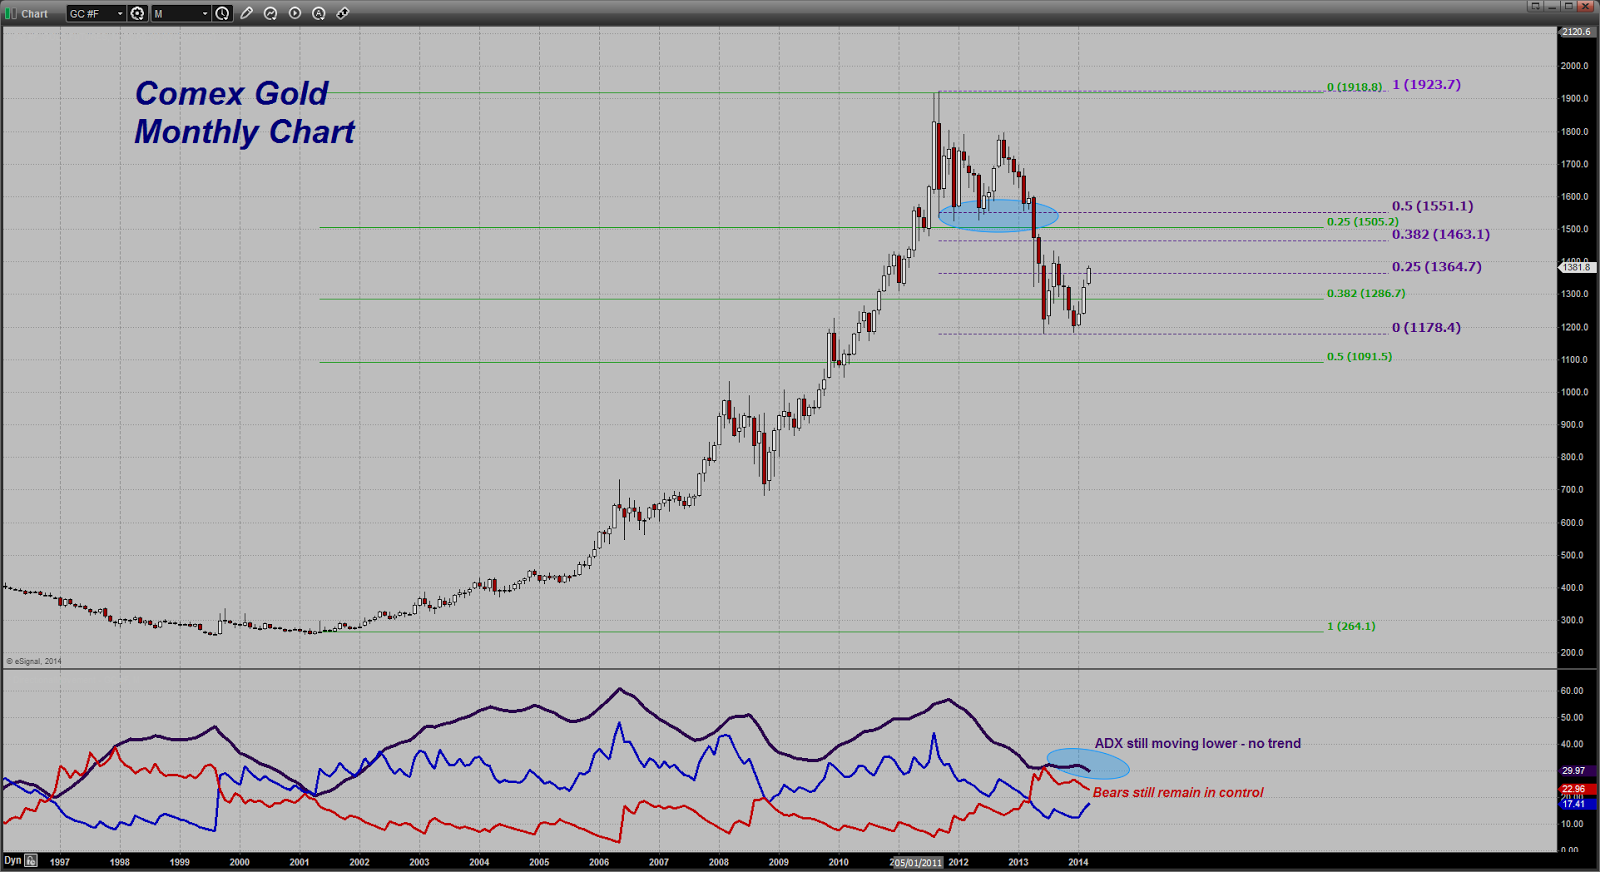
Let's start with the monthly gold chart and with my favorite technical indicator, the Directional Movement Index. I like this one ( I use many others) because it helps me to gauge sentiment and that is what I am after as a trader.

For a bit of a refresher course - the index is comprised of three lines. Two of them are called Directional Movement Indicators. One is the Positive Directional Movement Indicator; the second is the Negative Directional Movement Indicator.
When price is moving higher or sideways, and the +DMI ( the BLUE LINE ) is above the -DMI ( the RED LINE ), the bulls are in control of the market and sentiment is bullish.
When price is moving lower or sideways, and the -DMI is above the +DMI, bears are in control of the market and sentiment is bearish.
The third line, the ADX line ( DARK PURPLE ) is the trending indicator. If it is rising, no matter if prices are going up or going down, the market is trending. If it is falling, the current trend has been interrupted and the market is either reversing course temporarily or moving sideways. Only if this line is rising is the market in a trending move.
With these few facts in mind, let's now apply this to the chart and see what we can discern.
Go back to the early inception of the decade+ long bull move in gold and look at late 1999. There, for the first time in some years, the +DMI crossed above the -DMI. The bulls had regained control of the market from the bears. However, look at the ADX line - notice is was moving lower. What does that tell you?
Answer - the downtrend that had been in place was interrupted but the market had NOT YET entered a trending move higher. All that this indicator was telling us was the bullish forces had asserted themselves with enough vigor that the bears could no longer gain any further downside traction.
It was not until 18 months or so later that the ADX began to turn higher indicating that the strong potential for a trending move was now present. A few months later, that is precisely what happened and look at what happened to the price - it moved $150 or so higher.
Here is what is important to note however and why my current view of gold is what it is - that gold is currently in a BEAR MARKET on the long term charts with the latest move higher a bear market rally. Take a look again at that +DMI line and compare it to the -DMI line. When that +DMI first crossed over the -DMI line back in 1999, it DID NOT once ever fall below that line again for a full 14 years! Please bear in mind that even with the sharp fall in price during the onset of the US credit crisis in 2008, when price imploded lower by over $300, the +DMI remained ABOVE the -DMI line. The two lines did meet but the negative crossover never occurred.
How do we interrupt this? Answer - even though the price had been whalloped, bullish sentiment remained intact. Yes, it was battered and badly bruised, but it was still there.
Do you also see what was happening to the ADX line. Over this same period, it never once ROSE DURING A PERIOD OF FALLING PRICES. What does this tell you? Answer - all moves lower in price were viewed as price retracements in an ongoing bull market. The idea of a LONG TERM BEARISH TREND did not exist.
Now, let's look at what happened in early 2013. Do you see it and do you the significance of that event? If you guessed that the -DMI crossed above the +DMI and that the bears had seized control of this market for the first time in 14 years, go to the head of the class! In other words, the bullish sentiment had been finally broken completely. Bearish forces were now in ascendency in gold.
If you also look closely, you can see for the first time that the ADX line, the trending indicator stopped moving lower during this fall in price and actually began turning higher as price moved lower. For the first time in over a decade, the potential for a trending move LOWER was in place.
That potential was aborted when the price refused to break any lower than $1180, ( not far from the industry average of the cost of production ) and the potential downtrend was halted. However, the -DMI line remained above the +DMI line revealing that bearish sentiment towards gold remained intact.
If you look at the area within the ellipse noted on the chart, you can see that the ADX is again moving lower, this time as the price moves higher. That tells me that the market has not yet resumed a bullish trend higher. What it tells us is that the market is moving sideways and while the bears remain in control, the bulls are attempting to regain control of the market. As long as the +DMI remains below -DMI, the bears, while ceding ground at the moment, still dominate.
That explains the Directional Movement Indicator and why I maintain my view that the current move higher is a rally in a longer term bear market. Based on this analysis, gold is moving sideways ( falling ADX) and is in a range trade between $1425 on the top and $1180 on the bottom. Now one may not agree with my assessment, but that is the interpretation based on my analysis of this particular indicator. Again, one can disagree with using this indicator but I am basing my view on how this same indicator has served us so adequately over the last 14 years. That is an objective interpretation and as such as it is a fact.
Now note the Fibonacci Retracement levels I have noted on the chart. I have drawn them ( the purple dashed lines) off the all time high above $1900 to the double bottom low at $1180. As you can see, gold has managed to claw its way above the first Fibonacci retracement level of that plunge, which is the 25% retracement currently coming in near $1365. Can you now see why there was such a battle at that region and why gold seemed to hesitate before punching through this level last week?
Notice that the next important Fibonacci retracement level does not come in until near the $1463 level ( please bear in mind that I do not use the hard number but rather look at the zone near that area). If gold can crack resistance near $1425, that looks to me to be the most viable nearer term target.
However, and this is a biggie - the 50% retracement level - the level that is most commonly noted and which carries the most significance from a technical analysis perspective, does not come in until near the $1550 region. I think it no small matter that this region is not that far removed from the critical former support level within the ellipse drawn on the chart, namely the $1525-$1530 level. Remember, it was the downside violation of that level that started a bear market in gold; therefore for gold to undergo a change from a bear market to a bull market that level MUST BE RECAPTURED by the bulls and price must stay above it.
I have no doubt that should such a thing occur, the ADX line would be moving higher and the +DMI line would be firmly above the -DMI line.
Let's take a look at one last thing and we are done - I have also drawn in another set of Fibonacci Retracement levels ( the green lines ) that mark the bottom or beginning of the bull market in gold near 250-260 and extend to the high near $1920. That is also to provide some perspective. I did not want to emphasize this set of Fibonacci retracement levels too much because I am using the ADX and the +DMI and -DMI to essentially filter my reliance on this latter set. Those are clearly bearish.
However, I have noticed over the years, that the principle of reverse polarity oftentimes extends to the use of Fibonacci levels. This means that those former levels which oftentimes mark areas of chart support or resistance, can serve as resistance on the way back if - if they served as support on the way down - or vice versa.
Note how the price fall did not fall below the 50% retracement level near $1091. It has since then moved back above the 38.2% retracement level near $1287 but remains well below the 25% retracement level at $1505.
Putting this altogether, one can see levels at which they expect opposition to gold's advance intensify should it continue to move higher. Start near $1463 and go on up to $1550 or so and you have a big zone where selling can be expected to show up in size. You can also see that if bullish forces can take out these respective levels, the bears are going to be on the defensive if their lines are shattered.
I would also think that for the metal to claw itself back up to that region, some significant events, either geopolitically or economically, are going to have occurred.
Let's see how events unfold and what we get moving forward. For now, I am done writing this weekend and need a break!
Thanks for all the writing and analysis this weekend. I now sort of understand DMI!
ReplyDeleteMike Ehlert;
DeleteThanks Mike - glad it made some sense to ya...
Dan I wanted to compliment you on the outstanding postings you have done the past couple of months. You make your viewpoint very clear and you educate your readers as to why you think that way. I would not be surprised if your blog views are not increasing. You are currently giving some of the best analysis out there (for free) and providing a great service to the gold investing community. Please keep up the good work.
ReplyDeleteNowhuffo;
DeleteThanks very much for the kind words.This is my way of giving back. When I started trading many years ago, I had no one to teach me. Everything I learned, I learned the hard way and that means the EXPENSIVE way.
My sincere best wishes for a profitable trading/investing path for you!
This comment has been removed by the author.
ReplyDeleteSounds like overwhelming majority in Crimea choose to join Russia, how will gold respond tonight???
ReplyDeleteSounds like a peaceful resolution to me.
I love to read your blog Dan. Know why? Because you take a real approach to trading and I find the tools that you provide very helpful.
ReplyDeleteI’m not a “market trader”, but, I do buy/sell physical gold and silver and I have never EVER lost a dime when buying or selling coins because I have learned how to read the market thru people like you.
This is my formula to making money:
Never get emotional towards the market
One must have a lot of patience
Read everything that you possibly can, keep an open mind and do NOT become dogmatic on any given topic.
Thank you so much for your time and blog!
Keep it real brother and do not change what you are doing!
JOhn;
DeleteGlad to hear that the teaching has helped you my friend. That is what this blog is all about; providing folks with the tools to learn to read the markets and make their own, hopefully profitable, decisions and stop relying on they self-anointed "gurus" who are permanently one sided.
It seems that gold is getting a boner from the vote in Crimea. Did anyone expect a different outcome of this referendum? If yes, why?
ReplyDeleteThe question is will this erection prove sustainable over the coming weeks?
I guess that the ball is in the West's court now. The next stop is as per the well tried recipe: Sanctions!
" ..erection.." ? better edit your post my friend !!
ReplyDeleteHows aroused sound?
Deletehttps://www.tradingview.com/x/v3r1sLUA/
Thanks as always Dan, Knowledge is power.
Wolf, do you have problems with erection? Sorry man, just kidding. OK I'll try to use more appropriate analogy next time.
DeleteAbraxas; Wolf;
DeleteYou two rascals are going to cause me to put an "R" rating on my site. Either that or start selling ad space of Cialis or Viagra...!
How about we just say gold is getting a bid this evening! :o)
I am noticing that the Dollar is actually steady for a change this evening. The equities are apparently not too worried right now. THE situation over there in Crimea is volatile so we need to stay nimble and not get too dogmatic about near term direction right now as it is too fluid. I just hope the politicians in the WEst do not do something stupid.
Hey Dan, I hope I get "a bid" from my lady friend this evening, if you know what I mean ;-)
DeleteAnyway, if the past crisis are of any lesson, the next step in the West's arsenal are the sanctions and attempt to isolate Russia politically, militarily and especially economically. Perhaps they will try to impoverish them over a long period of time before pushing further, like they did with Iraq, Serbia etc. As you say, lets just hope they don't do anything (extremely) stupid.
P.S. If you start doing the Viagra ads make sure you post lots of charts with upward projections, head-and-shoulder patterns etc. :-)
If Putin goes north east we are in for a m major rally. Resistance will prove meaningless. In the meantime an awful lot of nervous shorts.
ReplyDeleteYeah, gold is up a little and U.S. futures are down a bit overnight but I'm expecting stocks to close green on Monday and gold to close red.
ReplyDeleteBond futures not buying the hysteria and hype surrounding Crimea.
I'm predicting at least 3 more "End of the World" articles from KWN within the next 24 hours.
I'm willing to bet that the Russian Oligarchs are using all their spare cash to buy Russian stocks hand over fist right now. Yet another huge wealth building opportunity for the 1% in Russia.
ReplyDeleteSame old, same old.
Putin and his wealthy henchmen are going to have huge opportunity to create jobs and growth in Ukraine which will proved to be a huge boom to the Russian economy in the next 3 years.
And at the top of the list, Putin will allow YUM and CMG to come in and open at least 500 stores, as long as the franchise opportunities are awarded to the oligarchy, LOL....
This comment has been removed by the author.
DeleteEvery sunken ship came with a good chart. Throw your charts in the garbage. They have been meaningless for 2 years. Charts don't factor in manipulation.
ReplyDeleteAnother guy I know who preached the same thing has closed his blog and is gone. He was anti manipulation and believed in charts. Lost his shirt. bye bye.
Got it Right;
DeleteYou need to change your handle to GOT IT WRONG, because a lot of us have made a lot of money by being short gold for some time. Sorry to rain on your parade but thanks for the laughs. We always welcome comic relief.
Keep crying the manipulation thing. Those of us that can actually read charts can actually make some money at this game.
@Got it wrong
DeleteIdk where the hell you've been but Dan nailed the huge drop in copper prices a week ago based off of the chart.and also the drop in gold when it fell to 1180. Literally the night before the huge drop.
This comment has been removed by the author.
DeleteGot It Right.....It's hard to understand why someone would invest in a market segment they believe to be totally manipulated by TPTB.
DeleteThat would seem like a bad investment strategy that relies completely on TPTB to suddenly lose control of something you or others proclaim they have total control over.
Logic would seem to dictate that it would be prudent to stay away from a manipulated market (if it indeed is) instead of participating in it in hopes the manipulation suddenly fails and reverses course.
There are some blogs who basically preach that if folks buy enough gold or silver that they 'll eventually defeat TPTB they blame poor metal performance issue's on.
Some of the talking head pumpers are essentially dragon-slayer types who incessantly wage a good vs. evil approach to the PM markets and their political rantings as well.
My belief is that those same dragon-slayers want to be seen as "the man" who bottom called the market. Those same dragon slayers DID NOT call the top in gold before,during or after it happened but instead clung to their sword and blamed it all on the CB's, JPM and others while price plummeted.
If you look at certain blogger philosophies (evil manipulation 24/7) and remain objective it all starts to look a little nuts or eccentric after awhile.
Interesting new video with JS, but not sure why he keeps referring to .80 as the failed line in the sand for the USD. It's touched to .79 5 times in the last 2 years and bounced off every-time:
ReplyDeletehttps://www.youtube.com/watch?v=KXGPzDq45gM&feature=youtu.be&a
Elijah;
DeleteHave seen or had time to review the video but 80 is not a significant level from a technical perspective. It might be psychologically but I doubt that as well. The zone of support in the USDX extends from near current levels down to about 78.90 or so. The big level below that is 78. I can see some real trouble for the Dollar if that were to give way which would kick gold higher. If the Dollar were to lose 78 for any reason, I do not see much on the chart in the form of technical support until one would get nearer 76. That would require one heckuva move in the Euro however...
Currencies are too volatile and unpredictable right now for me from a fundamental perspective so tread lightly if you are going to trade them and keep your position manageable. Whenever you get situations in which politicians can muck things up with some words at a microphone, you are completely at their mercy and I personally do not like trading in that environment... too much risk..
Dan, from a long time reader, many thanks for another outstanding post. This must have taken half of your Sunday to put together.
ReplyDeleteMy two cents worth: I agree with those who think we haven’t seen nearly enough capitulation/pessimism in the gold and silver markets to be sure that we’ve seen the bottom. I think we have to fall through 1180 and into the 1000s in gold in order to have a decent clean out. And it would probably do no harm if rather than a spike low, we see the price stay below 1100 for a few months so as to really sow the seeds of doubt and induce maximum wailing and gnashing of teeth among the gold bugs. Perhaps we will see a 1050-1180 range trade for 6 months, while stocks enter their final melt-up phase. In such a scenario, gold would seem like the worst investment on the planet – and perhaps that will be the final capitulation in sentiment towards the yellow metal that’s needed.
tom Wilson;
Deleteto be perfectly honest with you Tom, I would prefer to see a final washout occur which actually moves the hedge funds to an overall net short position and then, after that, get a good solid technical buy signal on the intermediate and longer term charts.
Whether or not we get that is unclear however. Ever since the Dollar started losing its luster ( this year) gold has responded as expected. If the Dollar cannot kick away from support here, it is likely that gold is going to stay well supported.
We need to see what the US economic data is going to look like here as the weather issues should soon be fading with the advent of more seasonable weather ( hopefully soon) and then perhaps we can get a true picture of what the economy is really like.
If the focus shifts back to US interest rates, and if those begin to creep higher, I think gold is going to struggle. If interest rates stay soggy like they currently are, gold will garner buying support.
It is anyone's guess right now... I am just watching the charts trying to read the events and reactions....
Hi,
ReplyDeleteI'm a new bee to this blog an thanks to Dan for valuable writeups.
What I'm hearing is upcoming deflationary scenario where equities, gold all goes down except USD.
And this should continue till 2017-18.
Please share your thoughts.
Hi Dan
ReplyDeletewhat are the settings for ADX DMI+ and DMI- ? I'd like to incorporate them to my charting. Thanks in Advance!
Sylvia
Silverlady;
DeleteI use 14 for the longer term charts but you can tweak it or "optimize" it and see if you can get a closer fit. ON the longer term charts, I tend not to do that very often however.
Hi Dan,
ReplyDeleteI haven't posted in awhile but have still been doing my best to keep up with the blog. You're writing is refreshing to say the least - I often wonder why this sort of knowledge is not presented to students coming up in higher education. I sure wish it was available when I was studying Economics as an undergrad - I always heard about the micro and macro economic influences in the markets, but technical analysis was rarely if ever presented.
One thing that really stood out to me after reading through your post twice is that since the beginning of 2013, while the bears have assumed dominance over the bulls (as indicated by the rise of the -DMI over the +DMI), the ADX line has been pointing down or been pretty much flat. In other words, it has not been trending up, to indicate that a true bear trend is upon us...
Which leads me to my next observation/question. If the bear sentiment were to reassert itself further, and the -DMI line were to further diverge above the +DMI line, would that be catalyst enough for the ADX line to start a rise up, thus unfolding a true, and potentially longer lasting, bear trend in the gold market?
Something to consider. Just a life long student of the markets like you sir. Look forward to your feedback whenever you have a chance to respond.
All the best!
P.S. I will echo Silver Lady's question as far as what chart timeframe you use when evaluating DMI for short term trading purposes.
"I often wonder why this sort of knowledge is not presented to students coming up in higher education. I sure wish it was available when I was studying Economics as an undergrad - I always heard about the micro and macro economic influences in the markets, but technical analysis was rarely if ever presented. "
DeleteWe need rich fresh young fish to take their money from them.
The game is even money. I win what they lose :)
So very true Hubert - and unfortunately in the world of trading the tuition for beginners is paid as lessons learned the hard way. Many traders, as Dan emphasizes, get blinded by their point of view, when the market is saying something else entirely. The charts don't lie - some just refuse to see that and stay stagnant as beginners indefinitely by failing to read changes in market sentiment. Lets hope we all get better and keep open minds in this game!
Deletehow does one calculate the actual claims per ounce of gold ?
ReplyDeleteI just go to Silverdoctors where their charts always PROVE that silver (thus gold) is on the edge of a massive breakout rally. it can't miss I tell ya.
ReplyDeleteAnother pumper/conspiracy site I avoid due to it's sensationalist nature.
DeleteSome of the more popular pumper sites also seem to have technical or virus issue's I'm trying to avoid as well.
Dan, thanks for the above analysis and effort you expend cranking all of this information out.
ReplyDeleteAppreciate it!
Quite impressed by the time and effort, quantity and quality of information Dan posted recently on this blog. To do this on a nearly daily basis in addition to active trading is amazing. Thanks for the sharing.
ReplyDeleteRussia ETF RSX charging off the lows, huge breadth surge today, with stocks being led by financials and retail again as crude oil and gold plunge.
ReplyDeleteThis rally was so predictable, you just knew that the Russian oligarchs were going to back up the truck and buy this selloff.
Now they will be even richer than ever.
Stay in the system.
I would encourage all to focus on the .618 fib retracement level (Not shown in Dan's chart) for Gold. That number is about $890 the ounce. I concur with Dan this is a bull move in a big bear downtrend for Au. We need a major washout to occur (ala April 2013) but bigger to expel the remaining bulls. Only then can we move higher as I doubt major geopolitical or economic events will be a factor in the resumption in the bull market for Gold. It will be purely sentiment driven.
ReplyDeleteBob, you are exposing yourself to wrath of "Gold can only go up unless manipulated" sect. You might get insulted for your ignorance, gullibility, and outright collusion with the devil.
DeleteSeriously, thanks for your post. $890 seems crazy to me at this point, but so did $1190 when gold was above $1900.
Could someone let me know where is the next downward resistance point if the gold goes below $1180? Thx
1340 1310
ReplyDeleteAnon, I meant what lies below $1180 should the gold fall through that level.
DeleteThanks man,
A
i love it though .. mux opens down 10% on 4 million shares , just to see half an hour later a sell off in gold … we really are muppets … well , more mux for the buck ! like Dan says play along !
ReplyDeleteAnon,
DeleteIt does not make any sense, does it? Goldfish are said to have 2 second short term memory and ours seem to be getting there in a hurry.
Anon - funny how no one cries manipulation when MUX went up 25% in four trading days last week, right up to fall 2012 resistance levels.
DeleteMDLGTO ,
DeleteDid I say manipulation ?? I am only saying that whomever decided to have a go , take profits off of gold today , you know buy the rumour sell the fact … whomever , the hedgfunds , the investors , etc , decided to make sure they put some shorts on the miners… I never said manipulation , I don't believe markets are always manipulated , only last April they were . Thats all , I have gone through it a while ago , no need to talk about it again . All I am saying is that we all muppets , thats all . I am glad MUX selling off , I am in cash and want to get back in , may get burned next time ! but not this time , this time I made a killing with MUX and with LSG , with LSG a pornographic amount of money … Now I am out , I am still in TRX , but that I am holding for my pension , and I am middle aged . Lets see where the market takes us . Good luck to you all , shorts are finally getting the sell off we were all waiting for … its been a while , I think we need to work the 1360 1375 range a little while to move higher , if not , well , we should go down 1340 1310 , and then below , 1280 etc … every one knows the numbers by now . Not manipulation today … profit taking and shorts having a go … haha and i am a gold bug and proud !
Right- sorry, shouldn't have said manipulation and certainly didn't mean you. Glad you made a killing-it's been a good Q1, volatility has been on the juniors' side. Good luck.
Deleteno problem man .. one has to be very careful with what one says these days ..! FOMC week plus triple witching on friday .. perfectly understandable time to see a correction .. thanks , lets see where this beast takes us the next couple of weeks . Best , etc
Deletei will start getting involved again at 1340 1310 … i am trading equities , will put some bids just below the gaps , tight stop losses , see what happens
ReplyDeleteThis comment has been removed by the author.
ReplyDeleteHilarious.
ReplyDeleteOnly hours after various "end of the world" calls for a market crash and soaring gold prices, gold and GDX is once again suffering from the risk of a "terrifying collapse".
Time and time again the gloom and doomers get the rug pulled. Yet they still have a huge following and make millions dispensing advice and forecasts which are constantly wrong.
Hey, I wanna become an "acclaimed expert" so I can hawk some doom and gloom as well and sell newsletters at $10/mo. to over 250,000 subscribers.
And I'd also love to run a fund whereby I fleece the frightened lambs by screeching about a market crash and exploding gold prices, only to take the exact opposite trade in my own account.
Wow, never believed that being a permagloomer was do easy and so profitable.
Mark, did you notice that some KWN "experts" have graduated from 40-year to 50-year "seasoned veterans"? This is like Gandolf the Gray becoming Gandolf the White. I guess in a few years there will be 60 plus-year senile experts who forgot they were mostly wrong.
DeleteWOW!!! Every non Gold Bug is still very very bearish. Today made them salivate. Sadly they are still very, very early on any type of sustainable decline.
ReplyDeleteAmazing how many can be stuck in the past. 2014 is NOT 2013 lol
Cheers
When it comes to gold it's always a sell on the news. Once shots went of in Afghanistan and the Gulf Wars gold plunged and the dollar drew attention back. Buyer beware gold has a destiny with $950 first.
DeletePlus this rally is getting long in the tooth, Fed is expected to continue tapering this week which won't bode well for a toppy bear rally.
DeleteJMO
Exactly, take your profits now and wait for the next extreme low.
DeleteI think DUST will be a great trade for a couple of months
Wow, I noticed the complete destruction of MUX and TRX today. Hard to believe that TRX can barely hold $2.50 price, I remember it was $9.00 about 6 years ago when gold was around $700.
ReplyDeleteOn the other hand, check out Chipotle and Green Mountain Coffee, unreal runs the last 5 years.
another absolutely brilliant analysis, many thanks
ReplyDeleteThis is MK from Hong Kong, China. I have been a long term reader of your blog and remain to be the silent majority. With such a great post that adds great value to the PM community, I have to click the post comment button and say a big THANK YOU.
ReplyDeleteThe whole analysis you have done can help the traders to choose appropriate Gold Trading Calls.
ReplyDelete