Here is a summary:
EXCELLENT GOOD
09/14/2014 09/07/2014 09/14/2014 09/07/2014
CORN 22 22 52 52
SOYBEANS 19 19 53 53
As you can see, the crops held steady this week with the share rated Good/Excellent at nearly 3/4 of the entire corn crop and 72% for the bean crop. These are superb numbers. Last Friday, frost issues heading into the weekend propped up both markets and enabled them to shrug off the extremely bearish numbers from USDA in last week's Supply and Demand report.
With the frost damage minimal at best, the conditions index and more importantly at this point, the maturity ratings are going to come back into focus.
What a difference a single week can make for maturity.
I have been commenting recently about the lag in maturity of the crop with my thesis being that the outstanding growing conditions, ample moisture and mild temperatures, have kept more energy heading into the ears ( kernels) and pods respectively instead of the plants following their more usual process of beginning to shut down. That I believe is going to lead to heavier/larger kernel fill and the same with pod filling ( heavier/larger beans).
This week however both crops took some nice jumps in their maturity process. Corn is 82% dented now compared to last week's 69% and the 5-year average of 85% so it made excellent progress in that regards. A full 27% is mature compared to 15% last week and the 5-year average of 39%.
The extreme northern tier states are the areas in which the crop is the most behind but that is to be expected. It is also the reason that we got that burst of shortcovering when meteorologists began inserting frost into the forecast last week ( in those same northern tier areas). With recent forecasts showing a more seasonal trend in temps, we should begin to see some catching up on that maturity level pretty quickly now. By the latter half of this week, most of the corn belt will be enjoying some very nice warm temps.
By the way, 4% of the corn crop has been harvested. That compares to last year's number at 4% and the 5-year average of 9%.
For beans, 24% of the crop is now dropping leaves compared to 12% last week and the 5-year average of 32%. Not too bad!
I do not see anything in particular in these reports that would lend much if any support to the bull cause at the moment mainly because the forecasts that I see are not putting in any hard frosts for some time.
Today's blip up was the result of traders looking ahead to tomorrow's USDA acreage numbers ( from a different division with the USDA) trimming some off of the recent numbers we just got. My own view is that anything they come up with is going to be too small, ( if at all ) to change the perception of an enormous crop coming very soon. We will just have to wait and see.
I am more and more of the view that the last straw that the bulls are going to be able to hold to is an early killing frost, and while these weather forecasts are always varying on us, odds are lessening. Another week or two of nice warm days is going to really push this crop towards its final stage of harvest.
Monday, September 15, 2014

China's Economic Data Unsettles Copper Bulls
More pressure on the copper price this morning is coming as a result of news out of China that its industrial production for August showed the slowest rise since December 2008. Industrial output did rise 6.9% from the previous year's August but that was down from a 9% increase in July.
If that were not disconcerting enough to traders, China's retail sales rose 11.9% in August which is a good number, but it too was down from a 12.2% gain in July.
While at face value, these are good numbers, ( and wouldn't we love to see them here in the US!), the problem is that they feed into ideas that overall growth in China is continuing to slow. The general consensus is that China will experience an annual growth rate this year of 7.5%. This recent data throws some cold water on that expectation.
Copper, which is already seeing selling as a result of lower economic growth forecasts ( see my recent post on hedge fund positioning on the short side of the market ), has moved down to retest last week's low in price near the $3.06 level. If bears can succeed in breaching that, I frankly do not see much in the way of chart support until one nears the $3.02 - $3.01 level.
As a side note, silver is also being pressured as is platinum which is continuing the theme of selling across the industrial metals. Palladium is a bit higher as I type these comments but its recent trend has also been lower. Clearly, investors are fretting about global economic growth rates.
If that were not disconcerting enough to traders, China's retail sales rose 11.9% in August which is a good number, but it too was down from a 12.2% gain in July.
While at face value, these are good numbers, ( and wouldn't we love to see them here in the US!), the problem is that they feed into ideas that overall growth in China is continuing to slow. The general consensus is that China will experience an annual growth rate this year of 7.5%. This recent data throws some cold water on that expectation.
Copper, which is already seeing selling as a result of lower economic growth forecasts ( see my recent post on hedge fund positioning on the short side of the market ), has moved down to retest last week's low in price near the $3.06 level. If bears can succeed in breaching that, I frankly do not see much in the way of chart support until one nears the $3.02 - $3.01 level.
As a side note, silver is also being pressured as is platinum which is continuing the theme of selling across the industrial metals. Palladium is a bit higher as I type these comments but its recent trend has also been lower. Clearly, investors are fretting about global economic growth rates.
Saturday, September 13, 2014
Large Specs Continue Playing corn from the Long Side....and Losing
I have been commenting for some time now about the apparent disconnect between the hedge fund community and their slavish devotion to computerized trading systems, which are especially fond of trending markets, and their positioning on the wrong side of a major downtrending move in the corn market.
Not only are they long, they actually increased their net long standing this past week just ahead of the major USDA supply and demand report.
Apparently, not wishing to be alone in their misery, they must have recruited some other large reportables in their quest, because that category of traders likewise increased their already net long exposure to the corn market.
Here is the chart... you tell me which way this market is trending:

Here is a look at the Commitment of Traders report as of Tuesday this past week:

Back in early May the hedge fund guys began liquidating longs when the front month corn contract was unable to scale $5.15 or so after several attempts. You can see their exit from the commodity by comparing the price chart above with their net position line on the COT chart. Down, down, down corn went with them still remaining net long, ever after scaling back exposure. That came to a halt towards the end of July when they began rebuilding long side exposure. That re-entry on the long side helped push corn back up another $0.20/bushel towards $3.80 but that did not last long. Down it went some more all the way towards $3.40 with the same group still increasing longs.
What is going on here? How could a group of traders who live by the charts and whose entire discipline of trading consists of blindly following trending markets, whether up or down, miss a move of this extent to the downside? Also, since they are typically considered "smart money" and the small, undercapitalized trader is considered the "dumb money", how can one explain that the small traders, or general public, have been on the winning side of the corn market while the "smart money" has proven to have been the "dumb money" this time around?
A few, whom I respect, have suggested that this is the result of spreads being plied by these large specs who have been buying corn and shorting wheat as the fundamentals for wheat have been even more bearish than for corn. US wheat has been expensive compared other sources and with the US Dollar strength, even more pricey.
That seems to make sense but a closer examination of the spread chart ( corn vs wheat) would seem to conflict with the idea that it was a large number of these spreads with hedge funds on the long side of corn and on the short side of wheat explaining their apparent wrong positioning in corn.
Note on the COT chart that the big move out of corn as far as net long positioning goes by the hedge funds, began in May. Now look at the spread chart and what do you see? In early May the line shoots up sharply from near 225 under and runs all the way to 140 under. Clearly corn was gaining on wheat as it narrowed its discount. But, and this is noteworthy, the gain in the corn/wheat spreads came as hedge funds were bailing out of corn


In other words, hedge funds were not buying corn but rather were liquidating longs and scaling back their exposure to the long side of the corn market even as corn was gaining on wheat. The spread was moving in favor of corn as they were getting out, not as a result of them coming in to institute fresh spread positions.
If hedge funds were positioning on the long side of the corn market because they were spreading corn against wheat, the COT report would have shown them INCREASING THEIR NET LONG exposure to the corn market ( not decreasing it as they did ) all the while the line on the spread chart was moving higher ( favoring corn). The exact opposite happened however.
Referring again to the spread chart, it topped out in favor of corn in mid-June where the spread retraced a large portion of its gains and widened out ( in favor of wheat) by some 65 cents. I think some of this was clearly tied to the events in Ukraine during which wheat experienced some big rallies as traders feared a disruption of exports from key wheat exporter Ukraine. Black Sea origin wheat is a big competitor to US wheat and the latter rallied in price as traders were concerned about more business coming the way of the US and possible "force majeure" declarations.
Those fears were put to rest, flared up again, and put to rest once more as can be seen from the up and down action in the spread since early August. For the rest of that month, the spread moved in a 35 cent range. Late in August, it began to turn again in favor of corn and has begun to climb once again.
Looking back at the COT chart and the build back in net long positioning for the hedge funds shows an increase that began in late July and has been for the most part continuing up to this past week.

You can also see that the corn/wheat spread has begun favoring corn at the same time these hedge funds have been adding to their net long position in corn. The theory that they are net long ( and on the wrong side of the corn market ) because they are working corn/wheat spreads thus NOW has credibility because the move in the spread in favor of corn is coinciding with the increase in their net long side exposure to corn.

How long they intend to work this spread however remains to be seen. Nor does this explain why they remained such large net longs in a market that clearly broke down in May of this year and has continued to move even lower in the face of one bearish USDA report after another.
The fact is that they have been stunningly wrong about corn and while they may now be playing a spread trade with wheat that is temporarily working in their favor, at some point they are going to be hit with the fact of a massive ( a RECORD) corn crop alongside of a record soybean crop which is going to run into issues with both STORAGE AVAILABILITY and TRANSPORTATION AVAILABILITY.
My concern for corn is what happens once these hedge funds begin to close out losing longs or reverse spread trades ( which will also result in liquidating the long corn side of the spread)? We could very well see more downside than many are expecting, even at these greater reduced price levels compared to several years ago.
Not only are they long, they actually increased their net long standing this past week just ahead of the major USDA supply and demand report.
Apparently, not wishing to be alone in their misery, they must have recruited some other large reportables in their quest, because that category of traders likewise increased their already net long exposure to the corn market.
Here is the chart... you tell me which way this market is trending:
Here is a look at the Commitment of Traders report as of Tuesday this past week:
Back in early May the hedge fund guys began liquidating longs when the front month corn contract was unable to scale $5.15 or so after several attempts. You can see their exit from the commodity by comparing the price chart above with their net position line on the COT chart. Down, down, down corn went with them still remaining net long, ever after scaling back exposure. That came to a halt towards the end of July when they began rebuilding long side exposure. That re-entry on the long side helped push corn back up another $0.20/bushel towards $3.80 but that did not last long. Down it went some more all the way towards $3.40 with the same group still increasing longs.
What is going on here? How could a group of traders who live by the charts and whose entire discipline of trading consists of blindly following trending markets, whether up or down, miss a move of this extent to the downside? Also, since they are typically considered "smart money" and the small, undercapitalized trader is considered the "dumb money", how can one explain that the small traders, or general public, have been on the winning side of the corn market while the "smart money" has proven to have been the "dumb money" this time around?
A few, whom I respect, have suggested that this is the result of spreads being plied by these large specs who have been buying corn and shorting wheat as the fundamentals for wheat have been even more bearish than for corn. US wheat has been expensive compared other sources and with the US Dollar strength, even more pricey.
That seems to make sense but a closer examination of the spread chart ( corn vs wheat) would seem to conflict with the idea that it was a large number of these spreads with hedge funds on the long side of corn and on the short side of wheat explaining their apparent wrong positioning in corn.
Note on the COT chart that the big move out of corn as far as net long positioning goes by the hedge funds, began in May. Now look at the spread chart and what do you see? In early May the line shoots up sharply from near 225 under and runs all the way to 140 under. Clearly corn was gaining on wheat as it narrowed its discount. But, and this is noteworthy, the gain in the corn/wheat spreads came as hedge funds were bailing out of corn
In other words, hedge funds were not buying corn but rather were liquidating longs and scaling back their exposure to the long side of the corn market even as corn was gaining on wheat. The spread was moving in favor of corn as they were getting out, not as a result of them coming in to institute fresh spread positions.
If hedge funds were positioning on the long side of the corn market because they were spreading corn against wheat, the COT report would have shown them INCREASING THEIR NET LONG exposure to the corn market ( not decreasing it as they did ) all the while the line on the spread chart was moving higher ( favoring corn). The exact opposite happened however.
Referring again to the spread chart, it topped out in favor of corn in mid-June where the spread retraced a large portion of its gains and widened out ( in favor of wheat) by some 65 cents. I think some of this was clearly tied to the events in Ukraine during which wheat experienced some big rallies as traders feared a disruption of exports from key wheat exporter Ukraine. Black Sea origin wheat is a big competitor to US wheat and the latter rallied in price as traders were concerned about more business coming the way of the US and possible "force majeure" declarations.
Those fears were put to rest, flared up again, and put to rest once more as can be seen from the up and down action in the spread since early August. For the rest of that month, the spread moved in a 35 cent range. Late in August, it began to turn again in favor of corn and has begun to climb once again.
Looking back at the COT chart and the build back in net long positioning for the hedge funds shows an increase that began in late July and has been for the most part continuing up to this past week.
You can also see that the corn/wheat spread has begun favoring corn at the same time these hedge funds have been adding to their net long position in corn. The theory that they are net long ( and on the wrong side of the corn market ) because they are working corn/wheat spreads thus NOW has credibility because the move in the spread in favor of corn is coinciding with the increase in their net long side exposure to corn.
How long they intend to work this spread however remains to be seen. Nor does this explain why they remained such large net longs in a market that clearly broke down in May of this year and has continued to move even lower in the face of one bearish USDA report after another.
The fact is that they have been stunningly wrong about corn and while they may now be playing a spread trade with wheat that is temporarily working in their favor, at some point they are going to be hit with the fact of a massive ( a RECORD) corn crop alongside of a record soybean crop which is going to run into issues with both STORAGE AVAILABILITY and TRANSPORTATION AVAILABILITY.
My concern for corn is what happens once these hedge funds begin to close out losing longs or reverse spread trades ( which will also result in liquidating the long corn side of the spread)? We could very well see more downside than many are expecting, even at these greater reduced price levels compared to several years ago.

Friday, September 12, 2014
Hedge Funds Exiting Gold once Again
Take a look at the chart and you will see what I meant in choosing the title for this post.
 In the last two months alone, the NET LONG position of the hedge fund community has been cut in half. That has come about by a combination of both long liquidation and the addition of new short positions. Currently it is at 71,376.
What is rather disturbing is that the number of outright long positions ( both futures and options combined ) of 129,921, remains rather large compared to the last time gold was trading near these levels in the first week of June of this year.

Back then, hedge funds were holding 121,428 outright long positions when gold was at the $1244 level. Their short holdings were at 70,364 compared to this week's 58,545. That put them at a NET LONG position of 51,064 compared to this week's 71,376. That is a net contract difference of over 20,000 contracts!
That is why it is important that $1240-$1235 did not hold. The potential for additional long side liquidation PLUS net shorting from these technically oriented hedge funds, opens additional downside probabilities. If the funds begin to wash out and also move more towards the short side, the selling pressure would intensify. It would be enough to set up a test of $1200 without some sort of upside catalyst occurring very, very soon.
What is rather disturbing is that the number of outright long positions ( both futures and options combined ) of 129,921, remains rather large compared to the last time gold was trading near these levels in the first week of June of this year.
Back then, hedge funds were holding 121,428 outright long positions when gold was at the $1244 level. Their short holdings were at 70,364 compared to this week's 58,545. That put them at a NET LONG position of 51,064 compared to this week's 71,376. That is a net contract difference of over 20,000 contracts!
That is why it is important that $1240-$1235 did not hold. The potential for additional long side liquidation PLUS net shorting from these technically oriented hedge funds, opens additional downside probabilities. If the funds begin to wash out and also move more towards the short side, the selling pressure would intensify. It would be enough to set up a test of $1200 without some sort of upside catalyst occurring very, very soon.
Weekly HUI Chart by Request
For those interested in looking at the mining shares ( frankly there are a lot more interesting charts than gold miners to look at right now) here is the weekly chart of the HUI.
Here is a quick overview....

The index has managed to avoid breaking down below the key 200 level; however, upside progress has been minimal. Note the series of lower highs indicative of general weakness in the sector.
This week's close pushes it back below the major moving averages that I track with it looking like a new downside push back towards 200 is possible once again. Much will depend on how the Dollar functions next week and what we get coming out of the Fed.
This index has been limping along in a lower grinding pattern for the last 21 months after suffering a devastating collapse two years ago when it failed to clear 525.
For now, the most likely pattern is more of the same grinding sort of trade. Value based buyers are bottom fishing in the sector on ideas that the stocks have been beaten up so severely that they have pretty much factored in the worst. The problem for these shares is that IF GOLD WERE TO LOSE $1200, and not be able to recapture it, many who bought the shares will throw them out fearing another fresh leg lower in the precious metal.
Either this index needs to get above 280 for starters, and preferably close the gap at 300, to turn sentiment or the gold price will have to jump sharply higher from current levels.
By the way, here is a current chart showing the HUI compared to the price of gold in a ratio. For the shares to lead the metal higher, this ratio would need to take out .200 for starters....

Here is a quick overview....
The index has managed to avoid breaking down below the key 200 level; however, upside progress has been minimal. Note the series of lower highs indicative of general weakness in the sector.
This week's close pushes it back below the major moving averages that I track with it looking like a new downside push back towards 200 is possible once again. Much will depend on how the Dollar functions next week and what we get coming out of the Fed.
This index has been limping along in a lower grinding pattern for the last 21 months after suffering a devastating collapse two years ago when it failed to clear 525.
For now, the most likely pattern is more of the same grinding sort of trade. Value based buyers are bottom fishing in the sector on ideas that the stocks have been beaten up so severely that they have pretty much factored in the worst. The problem for these shares is that IF GOLD WERE TO LOSE $1200, and not be able to recapture it, many who bought the shares will throw them out fearing another fresh leg lower in the precious metal.
Either this index needs to get above 280 for starters, and preferably close the gap at 300, to turn sentiment or the gold price will have to jump sharply higher from current levels.
By the way, here is a current chart showing the HUI compared to the price of gold in a ratio. For the shares to lead the metal higher, this ratio would need to take out .200 for starters....
Speculators Bearish Towards Copper
Here is a look at the current ( as of this Friday ) positioning of the players in the copper market. As the regular reader will already know, I pay very close attention to two key markets - Copper and Crude Oil, when trying to ascertain what the sentiment is of investors/traders towards overall economic growth.

I recently posted a chart detailing the performance of the S&P 500 versus the Goldman Sachs Commodity Index showing the vast underperformance of the commodity sector against equities in general. My conclusion, based on that chart, was that global growth was mediocre at best and that stock market strength is more a function of Yield Chasing by speculative forces in a near Zero interest rate environment rather than evidence of a robust growing economy.
The shift in speculators, especially the large hedge funds, into playing copper from the short side, confirms that view in my own mind.
Notice earlier this year how upbeat the hedge funds were on the future prospects of copper. July of this year saw them very optimistic. Here we are a mere two months later and they have completely reversed sides and have moved to a net bearish position. That dichotomy between the "other large reportables" category and themselves has evaporated ( although the former category is in the process of covering existing short positions ).
What to make of this?
Take a look at the copper chart and tell me what you see here.

Does this chart even remotely resemble one that is the least bit bullish? Of course it does not. Copper is continuing in its now 3 1/2 year old bear market.
Highs are progressively lower and lows are getting lower. What this tells us is that global demand for copper is not keeping pace with the increases in supply. Another way of saying that, is global growth is not strong enough to generate sufficient demand for the red metal that will allow it to eat through the available supply.
That is hardly the thing out of which strong, runaway inflation pressures are born.
By the way, here is an updated chart of the overall commodity sector as of the close of trading this week. Again, I am using the Goldman Sachs Commodity Index or GSCI.

The sector notched a 27 month low this week.
I have commented in the past that silver and copper tend to move in rather close sync.
Here is a chart of silver.

As you can see, the chart pattern is very similar to both the copper chart and the overall commodity sector, although silver has been bouncing around going nowhere for the last year.
What explains this lack of performance to the upside? Answer ' "Price manipulation" will scream the usual culprits. "The powers that be are actively working to manipulate the silver price lower!", they will breathlessly assert.
That is not the case however. Look at what the hedge funds are doing in there. They are abandoning the long side and beginning to move more towards the short side of this market as well, just like they have done with copper., and I might also add, a host of other individual commodity futures markets. I would guess, because this COT data only covers through Tuesday of this week and did not catch the fall through support near $18.60, that the hedge funds may now, as of this Friday, be net short in the market.
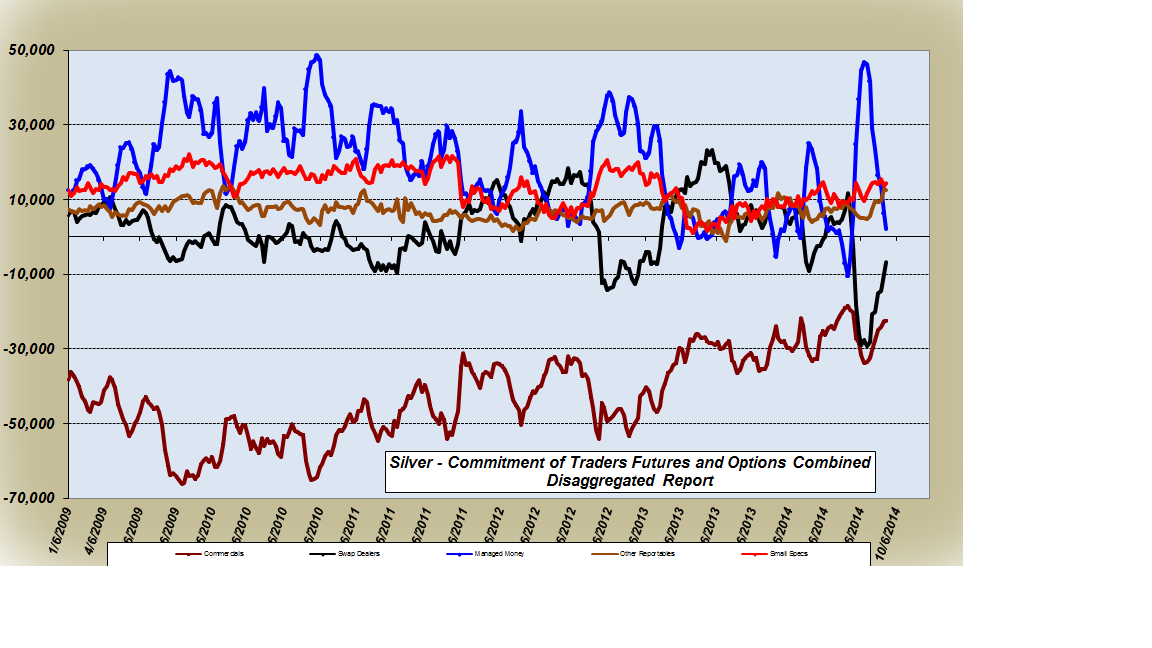 Keep these things in mind when you read outlandish predictions of roaring silver prices "any day now". Such claims are laughable at face value because they are based on NOTHING but someone's fevered imagination. Those who make such rash claims are exhibiting in full public, their apparent need for some sort of self-aggrandizement to make them stand out from the crowd. Serious traders will ignore such shills. Professionals DO NOT MAKE PREDICTIONS; they read the market and attempt to discern what it is saying.
For silver to turn around sharply, there will need to be some sort of catalyst in the form of a shift towards strong global growth, strong enough to generate inflation concerns and cause an inrush of money flows into the broader commodity sector. For the time being, that does not look to be on the radar screen.
How it handles this level near $18.60 will be critical. If it can hold near here, it will have a chance to reverse course and move back to try for a test of $20. Above that $21.50 stands as a huge hurdle to any further upside progress. At this point, the trend in silver is sideways to lower and unless we see something change on this chart, that is the way it looks as if it will continue.
I recently posted a chart detailing the performance of the S&P 500 versus the Goldman Sachs Commodity Index showing the vast underperformance of the commodity sector against equities in general. My conclusion, based on that chart, was that global growth was mediocre at best and that stock market strength is more a function of Yield Chasing by speculative forces in a near Zero interest rate environment rather than evidence of a robust growing economy.
The shift in speculators, especially the large hedge funds, into playing copper from the short side, confirms that view in my own mind.
Notice earlier this year how upbeat the hedge funds were on the future prospects of copper. July of this year saw them very optimistic. Here we are a mere two months later and they have completely reversed sides and have moved to a net bearish position. That dichotomy between the "other large reportables" category and themselves has evaporated ( although the former category is in the process of covering existing short positions ).
What to make of this?
Take a look at the copper chart and tell me what you see here.
Does this chart even remotely resemble one that is the least bit bullish? Of course it does not. Copper is continuing in its now 3 1/2 year old bear market.
Highs are progressively lower and lows are getting lower. What this tells us is that global demand for copper is not keeping pace with the increases in supply. Another way of saying that, is global growth is not strong enough to generate sufficient demand for the red metal that will allow it to eat through the available supply.
That is hardly the thing out of which strong, runaway inflation pressures are born.
By the way, here is an updated chart of the overall commodity sector as of the close of trading this week. Again, I am using the Goldman Sachs Commodity Index or GSCI.
The sector notched a 27 month low this week.
I have commented in the past that silver and copper tend to move in rather close sync.
Here is a chart of silver.
As you can see, the chart pattern is very similar to both the copper chart and the overall commodity sector, although silver has been bouncing around going nowhere for the last year.
What explains this lack of performance to the upside? Answer ' "Price manipulation" will scream the usual culprits. "The powers that be are actively working to manipulate the silver price lower!", they will breathlessly assert.
That is not the case however. Look at what the hedge funds are doing in there. They are abandoning the long side and beginning to move more towards the short side of this market as well, just like they have done with copper., and I might also add, a host of other individual commodity futures markets. I would guess, because this COT data only covers through Tuesday of this week and did not catch the fall through support near $18.60, that the hedge funds may now, as of this Friday, be net short in the market.
For silver to turn around sharply, there will need to be some sort of catalyst in the form of a shift towards strong global growth, strong enough to generate inflation concerns and cause an inrush of money flows into the broader commodity sector. For the time being, that does not look to be on the radar screen.
How it handles this level near $18.60 will be critical. If it can hold near here, it will have a chance to reverse course and move back to try for a test of $20. Above that $21.50 stands as a huge hurdle to any further upside progress. At this point, the trend in silver is sideways to lower and unless we see something change on this chart, that is the way it looks as if it will continue.
Thursday, September 11, 2014
Weekly Gold Chart - Updated
I have posted this chart fairly regularly now for some time to give a more intermediate term look at the gold market for those who are interested.
Not a single thing has changed for gold in over a year now. The metal is still trapped within a broad range defined on the chart. It is now working its way down toward the bottom of the range having failed to make any new weekly high. As a matter of fact, the pattern for gold has been one of LOWER HIGHS for over a year now within that range. That is suggestive of weakness.
This week the HIGHER LOW was broken and while it is still not the end of the trading session for Friday, the metal is threatening to put in a LOWER LOW within the range compared to the May close. That is a sign that the odds favor a move down towards $1200 unless it swiftly reverses and regains the $1240 level in a convincing fashion.

As said many times here to the point of taxing the reader's patience - it is no where written that a market must either be trending lower or if not, then trending higher. Markets can often move within broad, well-defined ranges for a long period of time; essentially they go nowhere. What that suggests is that supply/demand are essentially in balance within that range of prices. Unless an external development occurs which CHANGES the balance between the forces of demand and the forces of supply, the most likely outcome is a furtherance of the range trade.
I find it therefore rather disconcerting that so many of the gold-perma bulls continue their mantra of "Keep Stacking". For those who want to acquire some physical metal for insurance purposes, buying gold near the bottom of a well defined trading range makes sense. However, for those who "keep stacking" while they wait for the "any day now moon launch", theirs is a 'strategy' that has more odds of leaving them disappointed rather than obscenely rich as they dream. As mentioned above, range trades for markets are more the norm than solid, trending moves. The trending moves occur because something happens which triggers a new valuation of the underlying market whether that be an increase in the demand side of the ledger or in the supply side of the ledger.
Take for example the recent rallies in the cattle market, especially feeder cattle, and the recent sharp downdraft in the corn and bean markets. In the case of the bull market in cattle, the supply side has been constrained as ranchers and producers seek to rebuild herds devastated by back to back drought years in 2011 and 2012. The result has been increased demand with sellers of the animals in control as they have the luxury of sitting back and waiting for buyers to pay up and chase prices higher.
In the case of the bear market in the grains, the supply side of the equation continues to increase as the size of the expected harvest increases with each new USDA monthly report. That gives buyers the advantage because they have the luxury of sitting on their heels and waiting for even lower prices before committing in size.
In other words, both markets are imbalanced at the moment and seeking to find a price level or a range which satisfies both sellers and buyers that prices have reached a fair value level.
For gold to therefore move out of its range, a trigger will need to occur. Without that, gold bulls will be disappointed that the metal cannot escape from the upper boundaries of its 14 month long range. Gold bears also have not yet been able to crack prices below the bottom of the range starting near $1200 and extending down to $1180. Within this very broad range, a truce exists between both buyers and sellers. Shorter term within the range; however, there are signs that the buyers are regaining an advantage as demand is falling for available supply meaning sellers are willing to take less for their gold. As long as that is the case, the price will move lower. It will not be until they are more buyers at a lower price than there are willing sellers that the price will bottom. Trying to ascertain at what level that might occur is the business of traders.
If there is a change in either supply or demand, the market will reflect that as the price chart will change accordingly. Until then, prognostications, predictions, rash claims, etc, about surging gold prices are just that, rash claims founded on nothing but air with no basis in the price chart or in the technical patterns. Objective viewers and students of the markets learn to dismiss all such voices and listen to the only voice that matters - that of the market itself. It and only it knows when demand and supply have come into balance.
Not a single thing has changed for gold in over a year now. The metal is still trapped within a broad range defined on the chart. It is now working its way down toward the bottom of the range having failed to make any new weekly high. As a matter of fact, the pattern for gold has been one of LOWER HIGHS for over a year now within that range. That is suggestive of weakness.
This week the HIGHER LOW was broken and while it is still not the end of the trading session for Friday, the metal is threatening to put in a LOWER LOW within the range compared to the May close. That is a sign that the odds favor a move down towards $1200 unless it swiftly reverses and regains the $1240 level in a convincing fashion.
I find it therefore rather disconcerting that so many of the gold-perma bulls continue their mantra of "Keep Stacking". For those who want to acquire some physical metal for insurance purposes, buying gold near the bottom of a well defined trading range makes sense. However, for those who "keep stacking" while they wait for the "any day now moon launch", theirs is a 'strategy' that has more odds of leaving them disappointed rather than obscenely rich as they dream. As mentioned above, range trades for markets are more the norm than solid, trending moves. The trending moves occur because something happens which triggers a new valuation of the underlying market whether that be an increase in the demand side of the ledger or in the supply side of the ledger.
Take for example the recent rallies in the cattle market, especially feeder cattle, and the recent sharp downdraft in the corn and bean markets. In the case of the bull market in cattle, the supply side has been constrained as ranchers and producers seek to rebuild herds devastated by back to back drought years in 2011 and 2012. The result has been increased demand with sellers of the animals in control as they have the luxury of sitting back and waiting for buyers to pay up and chase prices higher.
In the case of the bear market in the grains, the supply side of the equation continues to increase as the size of the expected harvest increases with each new USDA monthly report. That gives buyers the advantage because they have the luxury of sitting on their heels and waiting for even lower prices before committing in size.
In other words, both markets are imbalanced at the moment and seeking to find a price level or a range which satisfies both sellers and buyers that prices have reached a fair value level.
For gold to therefore move out of its range, a trigger will need to occur. Without that, gold bulls will be disappointed that the metal cannot escape from the upper boundaries of its 14 month long range. Gold bears also have not yet been able to crack prices below the bottom of the range starting near $1200 and extending down to $1180. Within this very broad range, a truce exists between both buyers and sellers. Shorter term within the range; however, there are signs that the buyers are regaining an advantage as demand is falling for available supply meaning sellers are willing to take less for their gold. As long as that is the case, the price will move lower. It will not be until they are more buyers at a lower price than there are willing sellers that the price will bottom. Trying to ascertain at what level that might occur is the business of traders.
If there is a change in either supply or demand, the market will reflect that as the price chart will change accordingly. Until then, prognostications, predictions, rash claims, etc, about surging gold prices are just that, rash claims founded on nothing but air with no basis in the price chart or in the technical patterns. Objective viewers and students of the markets learn to dismiss all such voices and listen to the only voice that matters - that of the market itself. It and only it knows when demand and supply have come into balance.
Charting the Rate of Growth/Decline in the Fed's overall Balance Sheet
I find it rather fascinating to see the depths of denial that some will sink to when it comes to taking the Federal Reserve's clearly announced intentions to wind down its final Quantitative Easing program. You might recall that this last of their QE's was originally in the amount of purchases of both Treasuries and MBS (Mortgage Backed Securities) debt to the tune of $85 billion/month.
The chart I put together should hopefully dispel the rather foolish talk from some as referenced above and help objective and open-minded observers understand where the Fed is in its intent to bring this program to an end.
The chart details the Rate of Growth/Decline in the "Securities Held Outright" portion of the Federal Reserve Balance Sheet. For all practical purposes, this might as well be considered the total Balance Sheet ( the other items that are involved are dwarfed by comparison ) but that is another matter. Suffice it to say, one can easily tell the start up and the decline or winding down of the various QE episodes that have been in place since the Credit Crisis of 2008 and the Fed's response to that.
The data is constructed by creating a look-back period of 52 weeks and noting the percent change of the current week to the same exact week exactly one year previous. By looking at the data in this manner, we can get a very good view of how the Fed was responding to the lock up of the Credit markets and its determination to be a buyer of last resort of both MBS's ( mortgage backed securities) and Treasuries.

One can see the amazing surge in the 2009 as QEI was undertaken. Then we would see the end of a QE program, and the implementation of the next. The RATE OF INCREASE in the Fed's Balance sheet can easily be noted.
Fast forward to the beginning of this year and the Fed's announced intentions of a "TAPERING" of its final bond buying program with the intent to end it sometime this year.
Note well that the Fed did not say it was going to stop buying both Treasuries and MBS debt when it first began making the markets aware of its timetable to end QE4. It announced that, depending on the economic data, it would begin to scale back those purchases ( roughly $10 billion each month) until it ended them altogether.
Thus while its balance sheet continues to grow, the RATE OF GROWTH, year over year, is definitely declining. Indeed the Fed is tapering just as it said it would.
Just for comparison sake, here is a chart of the overall Fed Balance Sheet ( Securities ) so that the reader can see the growth. It is rather remarkable is it not? Even in this view, one can see the leveling off of the line over at the far right hand side. Their purchases are slowing down.

The reason for this short set of comments and charts is simple - there are those in the gold permabull camp who continue to deny that the Federal Reserve is tapering and preparing to end its QE programs. We will let the reader decide from the data whether their claim has any merit. I for one reject their specious assertions.
Now, it is going to be an entirely different matter if the Fed chooses to actually REDUCE the size of their balance sheet. That is going to be an interesting education we will all receive when once that happens, if at all. For all that one knows, they could simply choose to hold the securities (Treasuries and MBS debt) until they mature and return any interest earned to the Treasury.
The chart I put together should hopefully dispel the rather foolish talk from some as referenced above and help objective and open-minded observers understand where the Fed is in its intent to bring this program to an end.
The chart details the Rate of Growth/Decline in the "Securities Held Outright" portion of the Federal Reserve Balance Sheet. For all practical purposes, this might as well be considered the total Balance Sheet ( the other items that are involved are dwarfed by comparison ) but that is another matter. Suffice it to say, one can easily tell the start up and the decline or winding down of the various QE episodes that have been in place since the Credit Crisis of 2008 and the Fed's response to that.
The data is constructed by creating a look-back period of 52 weeks and noting the percent change of the current week to the same exact week exactly one year previous. By looking at the data in this manner, we can get a very good view of how the Fed was responding to the lock up of the Credit markets and its determination to be a buyer of last resort of both MBS's ( mortgage backed securities) and Treasuries.
One can see the amazing surge in the 2009 as QEI was undertaken. Then we would see the end of a QE program, and the implementation of the next. The RATE OF INCREASE in the Fed's Balance sheet can easily be noted.
Fast forward to the beginning of this year and the Fed's announced intentions of a "TAPERING" of its final bond buying program with the intent to end it sometime this year.
Note well that the Fed did not say it was going to stop buying both Treasuries and MBS debt when it first began making the markets aware of its timetable to end QE4. It announced that, depending on the economic data, it would begin to scale back those purchases ( roughly $10 billion each month) until it ended them altogether.
Thus while its balance sheet continues to grow, the RATE OF GROWTH, year over year, is definitely declining. Indeed the Fed is tapering just as it said it would.
Just for comparison sake, here is a chart of the overall Fed Balance Sheet ( Securities ) so that the reader can see the growth. It is rather remarkable is it not? Even in this view, one can see the leveling off of the line over at the far right hand side. Their purchases are slowing down.
The reason for this short set of comments and charts is simple - there are those in the gold permabull camp who continue to deny that the Federal Reserve is tapering and preparing to end its QE programs. We will let the reader decide from the data whether their claim has any merit. I for one reject their specious assertions.
Now, it is going to be an entirely different matter if the Fed chooses to actually REDUCE the size of their balance sheet. That is going to be an interesting education we will all receive when once that happens, if at all. For all that one knows, they could simply choose to hold the securities (Treasuries and MBS debt) until they mature and return any interest earned to the Treasury.
Subscribe to:
Posts (Atom)