"When misguided public opinion honors what is despicable and despises what is honorable, punishes virtue and rewards vice, encourages what is harmful and discourages what is useful, applauds falsehood and smothers truth under indifference or insult, a nation turns its back on progress and can be restored only by the terrible lessons of catastrophe." … Frederic Bastiat
Evil talks about tolerance only when it’s weak. When it gains the upper hand, its vanity always requires the destruction of the good and the innocent, because the example of good and innocent lives is an ongoing witness against it. So it always has been. So it always will be. And America has no special immunity to becoming an enemy of its own founding beliefs about human freedom, human dignity, the limited power of the state, and the sovereignty of God. – Archbishop Chaput
Trader Dan's Work is NOW AVAILABLE AT WWW.TRADERDAN.NET
Here is all one needs to know to explain why gold did what it did today:
The new home sales number showed the steepest drop in three years! Any questions?
What that translated to is very simple - Death to the Tapering! Long Live the QE Kings!
If that rotten July number was not bad enough, the insult to injury was the downward revision to the June number.
My view on this is simple - I have been posting charts of the Ten Year Treasury Note yield for some time now and have been remarking that it keeps pushing higher and higher and is closing in on that 3% mark. There is no way that rising interest rates in an environment in which salaries/wages are stagnant and job creation consists mainly of part time jobs is NOT GOING TO IMPACT HOUSING SALES.
I feel like I have been beating a dead horse but I repeat - the FED cannot be pleased with what has been going on in the Treasury markets because this entire phony "recovery" is predicated on one thing and one thing alone - CHEAP MONEY. Take that away and there is nothing else to support it.
The other side note to this is that these rising rates are going to significantly impact the US Federal Governments borrowing costs. When the national debt is over $17 trillion-gazillion-bazillion-whatever, and rising, even small rises in interest rates will have a significant impact to the nation's bottom line.
Bottom line - rising interest rates are a pox on the nation and on the economy and the Fed knows it.
Take a look at the Homebuilders' ETF. It is on course to close below its 50 week moving average even though it is valiantly trying to remain above it. The shorter dated moving averages have already turned lower indicating that the short term trend is down. I am monitoring this to see if we get any bearish downside crossovers of that 50 week. Either way, this sector is not particularly friendly on the charts.
It was easy to see that for today, the bonds were the beneficiary of buying related to no end to the QE bond buying program. When that housing number hit the market, they never looked back erasing all of this week's earlier losses and then some. The yield on the Ten Year backed down towards 2.81% after peaking near 2.92% this week. A collective sigh of relief along with a great deal of backslapping and hi- Fives was heard at the offices of the Fed.
Gold is right on the door of the psychological $1400 level in the aftermarket today. The December contract has missed that number by a mere $.10 as I type these comments.
Silver pushed up through $24 and looks very strong heading into next week as well. It looks to have very little in the way of impediments until it nears $24.70. If it clears that, silver could get quite exciting, very quickly. It will be interesting to see if it can hold above $24 as it goes out here on Friday afternoon. There are sellers around at that level as well as the $1400 level in gold.
The US Dollar was undercut by the weak housing number as it lost any gains it had against most of the majors with the exception of the Yen (barely) and the Pound (barely). The forex markets are ultra sensitive to any news whatsoever right now that they regard as potentially impacting Federal Reserve policy. Thus, we will continue to see more volatility and unpredictable price swings upon the release of each bit of economic data. I for one have sworn off trading the currencies until I see something more definitive as far as a trend goes. I am not a masochist and will leave them to others who are more tolerant of ulcers and other stomach wrenching maladies.
The HUI still needs to clear 280 on a weekly closing basis to kick the mining shares into a stronger uptrend. Price action has been very constructive but there remains work to be done on that price chart to dispel any doubts.
Today was one of those days in which it was hard to find any commodity that moved lower. Cattle did but they have been so bullish of late that I can understand them not participating in the buying orgy today. Soybean traders have effectively managed to kill the crop once again, as they do every single year without exception. First it was too cold and too wet; then it was too hot, then it was too cool and the crop was lagging and needed heat to mature. Now that it has turned hot, it is too hot and too dry so it is time to kill all the beans once again. If you think gold and silver are nuts, try beans. They are worse especially when the mindless machines are buying.
Sharply rising soybean prices which are oftentime viewed as a proxy for food prices by some, tend to feed into silver buying on the thoughts of an inflation play. Remember, silver will outperform gold to the upside when inflation fears are dominant.
Personally I think the funds are driving soybean prices to ridiculous levels as all they are managing to do is to destroy foreign export demand for our beans at current levels. Old habits die hard in the commodity markets however and the combination of two words, "hot" and "dry" is all that is needed to spark a wave of short covering and more buying. We are not going to run out of beans anytime soon with those massive S American crops and even if this year's crop does get smaller from previous projections, there are more than ample supplies of soybeans that are going to be around. Wait until the combines start rolling...
Maybe silver can take out chart resistance before that happens. We'll see. I will be talking about this on the KWN Weekly Metals Wrap so tune in to listen to my comments. I will get some price charts up later this afternoon as my schedule permits.
By the way, J P Morgan continues to stand for delivery in gold. They have taken the lion's share of all deliveries this month.
The way I am reading today's release of the FOMC statement is more of the same - some on the FOMC are ready for tapering; some are not. Translation - we are back to watching the economic data releases and attempting to ferret out what is in the mind of these monetary masters from which the markets are begging their crumbs.
I still think that when it comes down to brass tacks, the key data is going to be the payrolls numbers. As far as the Fed is concerned, inflation is non-existent and thus there is no need, as of now, for them to cut back on the bond buying. What will tip the FOMC in favor of tapering sooner rather than later is strength in the jobs market and there is not a lot of that which I can see.
Part of the reason is this damnable Obama-care. It is a job killer and everyone in Washington, including the administration, which rammed it down our throats, knows it. That is the reason they gave the exemption or delay to corporate America in implementing this disaster.
Until this albatross is taken off the necks of the US job creation machine, I do not see any SHARP increases in hiring. Instead, I think we will see more of the same - mediocre increases in hiring which a large percentage of that in the form of part time jobs.
The bond market however seems very concerned that those who favor the early tapering are going to win out and thus we are watching interest rates on the long end of the curve continuing to rise. The yield on the Ten Year just missed 2.9% today! Methinks that those in the FOMC who are watching these long term rates rising are getting more than a bit concerned about that.
Gold is trading in the same confused manner as some of the other markets with it bouncing higher, dropping lower, bouncing back up again and then moving lower. It is readily apparent to me that there is simply not much in the way of very strong conviction when it comes to gold right now. The bulls have brought prices a long way from off the lows under $1200 but the bears seem fairly resolute in selling shy of $1400. We need to see that handle change from "13" to "14" to spark another strong wave of hedge fund short covering and bring in some more hot money.
That being said, thus far the metal is holding above the major moving averages with the 50 day down close to $1298 and rising. There looks to be a pretty good zone of support between $1344 and $1324 on the chart with resistance just above $1380 and then again just shy of $1400.
Silver is being buffeted by the same winds that are blowing through the rest of our markets but has been able to maintain its footing above $22 with buyers emerging down near $22.50, a former resistance level now turned chart support.
The mining shares as evidenced by the HUI were spanked fairly hard today closing down 4.60%, which is fairly dramatic. The chart shows hefty resistance at 280 with good support near 255 and again near 237 or so. The 50 day moving average is moving higher with the market trading above that level so the bulls currently have the advantage.
It is a damned shame that our once proud system of financial markets, the envy of the civilized world, has been reduced to a quivering blob of Jello, sitting at the feet of the FOMC like some sort of lap dog begging for scraps of food from its master. I for one wonder how historians are going to record this period and whether or not they will chronicle this as just one more step down the path towards mediocrity and decline in our nation. Personally, as someone who loves the markets and the study of fundamentals upon which solid investment decisions were once made, it disgusts me to witness this unseemly beggary and sycophantic attitude.
Since when did the well being of our markets become so utterly dependent on the vicissitudes of 12 men and women sitting on a committee? This is not the capitalism that made our nation the marvel of the world.
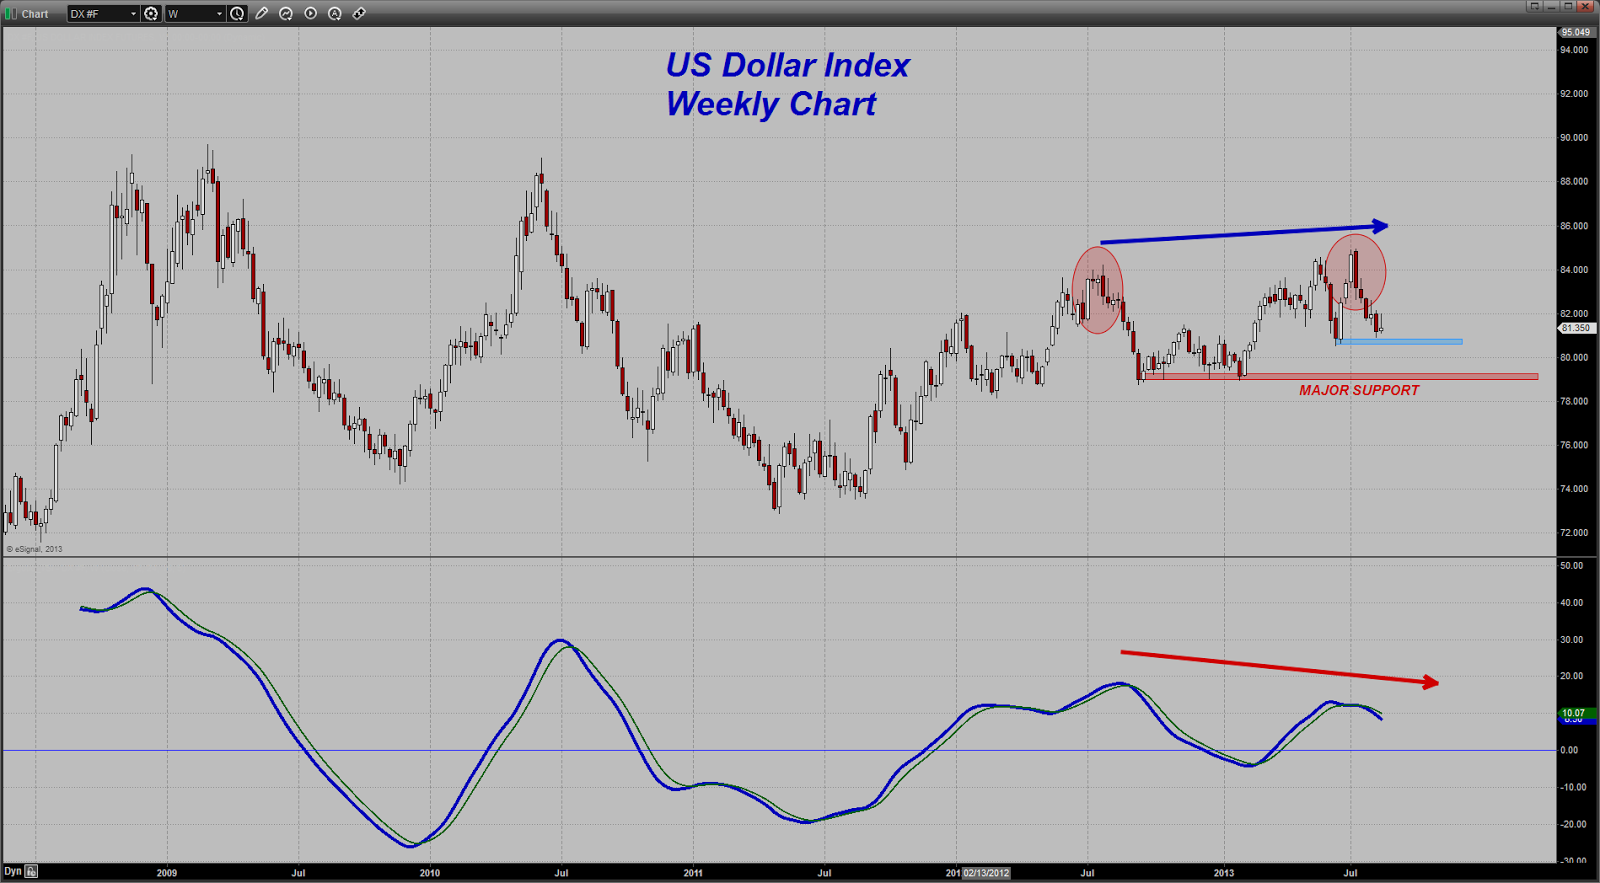
The US Dollar, as measured by the US Dollar Index or USDX, started the year off on the strong note and looked to have regained its status as "King Dollar" until the beginning of last month when it put in an outside reversal week lower on its weekly chart. Interestingly, it put in the same exact pattern a year ago in the same month. (By the way, for those are not technical analysis geeks like I unfortunately am - an outside reversal week pattern is one in which a market which has been trending higher makes a NEW HIGH for the week only to then CLOSE LOWER than the previous week's LOW. It is generally regarded as a fairly reliable BEARISH signal).

It is difficult to point to an exact reason for this change in sentiment towards the Dollar right now given the fact that the US economy is in better shape than Europe and Japan ( that is not saying much) and appears to have entered a season of rising interest rates accompanied thus far by a soaring stock market. For the first half of the year that was all that investors needed to see and into anything US Dollar related they ran. Something has changed that - or at least it so seems.
It might well be that the US fiscal house disorder is coming back to the forefront of investors'/traders' minds once again as the federal government is up against its borrowing limit and once again the usual circus in Washington on the Potomac is back in town. Whatever the cause, the Dollar has now moved lower in 4 out of the last 6 weeks and in the two weeks that it did manage to close higher, the high of that week did not exceed the previous week's high price. That is not exactly a show of confidence as it is certainly not bullish.
While it is still higher on the year (barely) the chart is picking up some signs of waning upside momentum. The high price made this year in July exceeded the high of the previous July 2012 and that outside reversal pattern but the indicator did not score a fresh high; instead it registered a lower high resulting in a BEARISH DIVERGENCE. This in and of itself is NOT A SURE Sell signal unless it is confirmed by subsequent price action, which of course the market did. Even at that, the Dollar has not broken down technically on the price chart .
I would have to see a weekly close BELOW the band of "MAJOR" support noted on the chart to turn bearish the Dollar. Right now I am ambivalent towards it, being neither bullish or bearish except for the shortest of term trades.
Please click on the following link to listen in to my regular weekly audio interview with Eric King over at the KWN Markets and Metals Wrap.
http://www.kingworldnews.com/kingworldnews/Broadcast/Entries/2013/8/17_KWN_Weekly_Metals_Wrap.html
I like to track this ratio to see if I can glean what investor sentiment is towards the precious metals in relation to stocks. As can be expected, with the horrific sell off in the precious metals sector this year, coupled with the surge in US equity markets into all time highs, the ratio has been rising since the beginning of this - until the beginning of last month (July) when it began to move in favor of gold once again.
It could very well be that some large investors are seeing US stocks as overvalued and in the latter stages of a bull run compared to a beaten down sector which is undervalued and needs further long side exposure. For whatever reason, over the last 6 weeks or so, gold has outperformed the Dow Jones.
Additionally, the indicator below the price graph has now crossed below what is a signal or trigger line for the first time this year. That would entail that gold is coming back into favor when compared to expensive stocks.
while I do not like becoming too dogmatic when using these ratio charts, they are still very informative as to SENTIMENT.
By the way, I have noted the very clear, textbook perfect example of what is called "Bearish Divergence" on this chart. While the ratio was going on to make new highs the indicator measuring momentum was making a series of lower highs. In other words, the upside momentum was waning. Translation - there appears to be a very slow yet growing shift in sentiment in favor of gold and away from equities.
This does not mean that the stock market has topped out and the bull run is over - what I think it means is that gold is slowly coming back into favor among some larger investors.
Stay tuned!
There is no doubt in my mind that we have seen the lows in yields for Treasuries perhaps for the rest of my lifetime. The long bond has topped out on its price chart indicating an end to the THREE DECADE LONG bull market in bonds. While that does not mean we cannot get some intervals during which interest rates move lower again, I do not expect to see the long bond to ever again exceed the top shown on this chart. If it were, it would signify a PROLONGED DEPRESSION the likes of which would be difficult to envision.
The weekly chart is also showing a rising ADX line indicating the start of a trending move, in this case to the downside. I find this rather interesting because I believe that the Fed does not want rising long term interest rates. For whatever reason, the chart is showing that the bond market is expecting the exact opposite.
Already today the Ten Year hit a TWO YEAR HIGH yield of 2.864% at one point before settling the day at 2.829%. Think about this - it was just 14 basis points shy of hitting 3% today! I wonder how that is going to play with the real estate/housing markets?
There is obviously rotation going on with money moving out of bonds but whether or not the majority of that is going into equities is a bit unclear to me. It sure seems like some of it is heading back into the base metals/precious metals and certainly the mining shares right now. One thing is clear - it sure ain't going into the home building stocks!
Also, check out the home builders ETF, XHB, and look at the break in the uptrend. It sure seems to me like the Street is noticing this rise in interest rates and is treating the homebuilders accordingly with an expected negative impact to the industry. If the Street sees it, my guess is that the Fed is also seeing this and is not happy!
The World Gold Council this week released some very interesting data which I want to relay here although you can get it firsthand by clicking on the link below to take you directly to their site.
http://www.gold.org/media/press_releases/archive/2013/08/gdt_q2_2013_pr/
I want to first start with a chart of the largest gold ETF, GLD. I consider this ETF to be a very good proxy for overall WESTERN gold investment demand.
Notice how the gold holdings in the ETF have been consistently dropping for this entire year thus far. GLD Began the year with 1350 tons of gold reported in their holdings. As of yesterday, August 15, reported holdings are 913 tons. Doing the math we learn that a total of 437 tons have gold have been offloaded from this ETF by predominantly large WESTERN investors, aka, hedge funds. So we have it established that investment demand for gold in the West has been pitiful. That we know and have stated repeatedly as the gold price chart has continued to deteriorate for most of this year.
However, what stands out to me in the WGC data is this: (By the way, I could not help but notice that they misspelled the word ' jewelry)!
Globally, jewellery demand was up 37% in Q2 2013 to 576 tonnes (t) from 421t in the same quarter last year, reaching its highest level since Q3 2008. In China, demand was up 54% compared to a year ago; while in India demand increased by 51%. There were also significant increases in demand for gold jewellery in other parts of the world: the Middle East region was up by 33%, and in Turkey demand grew by 38%.
Bar and coin investment grew by 78% globally compared to the same quarter last year, topping 500t in a quarter for the first time. In China, demand for gold bars and coins surged 157% compared with the same quarter last year, while in India it jumped 116% to a record 122t. Taking jewellery demand and bar and coin investment together, global consumer demand totalled 1,083t in the quarter, 53% higher than a year ago.
Look at that last sentence again.... total global consumer demand for gold totaled 1,083 tons in the second quarter. The report also states that demand for bars and coins was 508 tons - that is more than enough to completely absorb the 437 tons of gold dishoarded by hedge funds!
What the hedge funds have been throwing away, the Chinese and the Indians have been buying as well as smaller buyers of bars and coins.
This fits with the Commitment of Traders reports which have been detailing the continued long liquidation by the category of traders known as Managed Money or Hedge funds, not to mention the rapid escalation of new short positions in gold.
It has been this solid, sustained demand for PHYSICAL GOLD that has put the price floor under this market and prevented the bears from cracking the market lower. However, in and of itself, that buying was insufficient to drive the price SHARPLY HIGHER. To do that, MOMENTUM BUYERS must make their entrance into the metals markets. That now appears to be occurring; not in a large way as of now, but nonetheless it is happening.
As mentioned yesterday hedge funds are beginning to take a look at the precious metals once again and getting some exposure on the long side. They are grossly under-invested in this category (and that includes the mining shares) and thus we are seeing somewhat of a rebalancing of their portfolios to favor a larger exposure. This bodes well for the metals as we head into the historically strongest season for gold prices.
Oh and by the way, It is certainly helping matters to learn that Paulson has cut this holdings in gold in a significant way. A move by such a large player of his nature goes a long way in assuaging fears that more "capitulation" type selling in gold is coming. Maybe we can look back at some point in the near future and point to his selling as the final bottom. I find that incredibly ironic. It also goes to show how the STREET shows no mercy and has no friends whatsoever but is a violent, cruel and brutal entity. The smaller barracudas seem to relish harassing the larger sharks when opportunity presents itself.
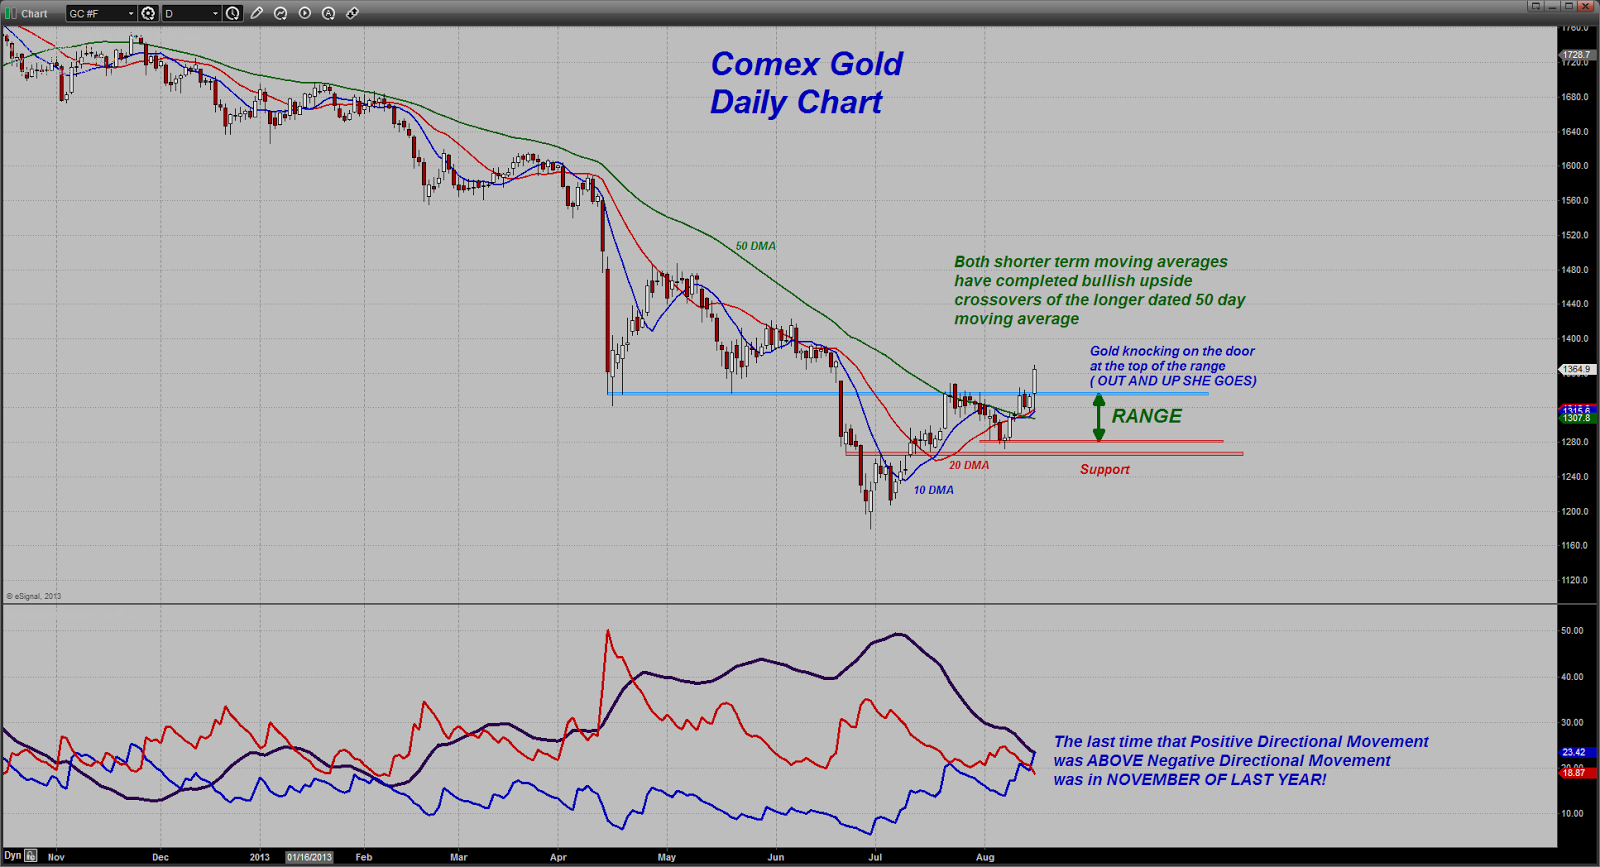
The metal has been knocking on the door at the top of the range trade/consolidation for some time now but has been unable to break through. Today it did so in a very big way.
Note the change in the indicator which I have posted previously on the metal. Positive Directional Movement, or + DI, has now bullishly crossed above the Negative Directional Movement line for the first time since NOVEMBER of last year!
Also, both of the shorter dated moving averages have completed upside bullish crossovers of the 50 day moving average.
Lastly, the move off the low is not yet at 20% so we can not officially state that gold has entered bull market territory as silver has done, but the chart is significantly improved and looks quite strong at the moment. A change of handles from "13" to "14" would be very significant as it would signal that WESTERN INVESTMENT INTEREST in gold has returned.
Thus far it has been very strong Asian demand for the metal that has kept it supported. That has provided the solid floor of support that we have been seeing of late. What is necessary to drive it higher however is that investment demand which is not as price sensitive as the physical markets over in Asia are.
One more thing - the seasonal tendency is now firmly on the side of the bulls as the bears have run out of time. Generally speaking the latter part of August into October is strong for gold prices as the festival season buying commences. Combine that with a renewed investor interest in the metal ( based on what I am seeing in the ETF) and the bears are going to have to look around to find some recruits for their side in a real hurry.