"When misguided public opinion honors what is despicable and despises what is honorable, punishes virtue and rewards vice, encourages what is harmful and discourages what is useful, applauds falsehood and smothers truth under indifference or insult, a nation turns its back on progress and can be restored only by the terrible lessons of catastrophe." … Frederic Bastiat
Evil talks about tolerance only when it’s weak. When it gains the upper hand, its vanity always requires the destruction of the good and the innocent, because the example of good and innocent lives is an ongoing witness against it. So it always has been. So it always will be. And America has no special immunity to becoming an enemy of its own founding beliefs about human freedom, human dignity, the limited power of the state, and the sovereignty of God. – Archbishop Chaput
Trader Dan's Work is NOW AVAILABLE AT WWW.TRADERDAN.NET
The ADP numbers yesterday were indeed a precursor to today's very strong payrolls number. The market was expecting a good number and that is exactly what it got - and more. Going into the report a 215K increase was the consensus - instead we got a 288K reading.
A bit later this AM, the June ISM service sector numbers came out and that also helped to confirm that strong jobs number. The employment component of that series came in at 54.4 against a 52.4 reading in May.
Stocks loved the number as the Dow rose above 17000. The S&P 500 and the Russell 2000 both moved higher as well. Any time weakness appears and it looks as if the Bears are finally going to get their day in the sun, back up these equity markets go only to set another new all time high. It is nothing short of astonishing. Fighting the tape has been a fool's errand when it comes to these equity markets.
The VIX, or Volatility Index ( I prefer to call it the Complacency Index ) is flirting with levels last seen in February 2007! Amazing!
The yield on the Ten Year rose as high as 2.69%. According to one of the CME markets, the odds of a rate hike by the Fed at its June 2015 FOMC meeting rose to 57%. Yesterday the odds were 51%. Last month the odds were 43%. It is clear that the a majority are coming around to the view that higher rates are in store next year. If the market becomes convinced that the Fed is going to be able to stay on top of any nascent inflationary pressures, gold is going to lose some of its current friends.
I suspect that today's strong number is going to shift more of the focus on the wages numbers coming our way in the future. Traders/investors are going to want to see some evidence of wage inflation. So far they do not seem concerned. As long as that is the case, the Fed can remain accommodative and will not be in a hurry to kick rates higher. Still, one can clearly see a subtle shift coming in regards to sentiment towards higher rates.
As far as gold is concerned, the metal looks as if geopolitical events in Iraq are continuing to provide some support. The stronger Dollar coming on the heels of the payrolls number, provided pressure. The lack of wage inflation did likewise. However, while the market bent, it did not break. The geopolitical premium remains. Also, while I have noticed that the TIPS spread has weakened somewhat this week, it is still up near 6 month highs.
If grain prices continue to work lower, it will be up to the energy complex to bring support to the commodity sector as far as inflationary aspects are concerned. Right now crude is continuing to weaken and has fallen down near that support zone I noted on the crude chart I put up in yesterday's post.
Coffee, sugar, cotton, soybeans, wheat and corn are all lower today - along with crude, heating oil and unleaded gasoline. Cattle are strongly higher as news hit the market after the close of pit session trading yesterday of a record $1.58 paid for cattle in the Southern Plains. I had to double check that price print as I thought I was hallucinating. WOW! those who have cattle to sell are sitting very pretty right now. By the way, as a side note, I just picked up my brisket for my July 4th barbeque - GREAT GOOGLY MOOGLY! I wonder how it now compares to caviar as far as price per ounce? AS I have said before in many posts - there is not going to be much if any relief in sight for meat prices for the remainder of this summer. We are going to have to wait for the 4th quarter, but especially for Q1 2015 for any significant relief.
On the currency front - ECB President Draghi was out making some dovish comments once again. Those, while not the main mover in the Forex arena, certainly did nothing to soothe any Euro bulls. One gets the distinct impression, especially after today's payrolls number, that interest rates, if they are going to go up, will certainly be doing that here in the US, well before they will be over in the Eurozone. That should keep the Dollar supported at the expense of the Euro.
You can see on the chart of the long bond that prices have been falling recently and have broken the uptrend line shown. Bonds have bounced however from the support zone noted. They will need to at a bare minimum, take out that level before we can say with any degree of certainty that a serious downtrend has begun. It is too early for that right now. We will need more confirmation in the price action.
If however we begin to see a STEADY series of good payrolls numbers, along with rising wages, I fully expect this chart to break down for good. The jury is out so we wait.
Happy Independence Day ( July 4th) to my American readers ( and to anyone else who might be celebrating along with us). When I look at the incredible system of government given to us by our Founding Fathers, and then shift my attention to what we now have left of it, I fear my kids and grandkids are not going to be able to see anything remotely in common with it by the time they are grown. Liberty is precious precisely because it is so rare among the annals of human history. This generation seems to have forgotten that although one wonders if they ever knew it in the first place.
I will get some updated charts up later... busy morning...
Once again we got another surprise in the crude stocks number as it hit the wires this morning. The trade was looking for a drop of 1.7 million barrels. Instead it got 3.2 million drop.
Crude oil had been weaker ahead of the data on concerns that Libyan oil exports might be on the rise but it rebounded when the EIA data hit.
Ominously, the market could not hold its gains and begin to retreat once again.
This price action is confirming my suspicions that the massive hedge fund net long position in the market ( a position that was drawn down somewhat in last week's COT data) is becoming more of a concern to players. When rallies are attracting long liquidation instead of a batch of brand new hot money flows, one has to be cautious.
Here is the chart.
As I noted yesterday, the market could fall down to the uptrend line and still maintain the bullish posture. That comes in near $103.50. It is also the 25% Fibonacci Retracement Level of the entire rally that began early this year. See the red ellipse....
The former resistance level, now turned support, near the $105 level, finally gave way today. Under normal circumstances, the loss of that level would portend lower prices. However, we have a big payrolls number out tomorrow and there is the possibility that if the number comes out stronger than what the market currently expects ( and it does look as if the market is expecting a good one - certainly copper does ) then we might see crude move higher on ideas that consumers are more likely to maintain strong demand domestically for gasoline as they head out for summer vacations. That plus the fact that economic activity might increase.
I have no idea what we might get on that volatile payrolls number but am just postulating a possible market reaction.
The flip side is that if the number is poor, crude could succumb to further downside follow through. We will just have to wait and see.
I will try to get some additional commentary up later today. It has been a very busy day....
A quick note - gold continues to struggle with this $1330 level. There has been a fairly rapid build in speculative longs in that market as well so the longer it cannot break through this current cap, the more the odds increase of some stale long liquidation. Again, it will be at the mercy of the payrolls data tomorrow.
It will be interesting to see if we do get a strong number, how gold reacts to it. Many will expect a strong number to pressure the price of the metal as it will lend credence of a sooner-than-expected tightening of interest rates by the Fed. It is possible however that some might see a strong number as a key ingredient to the inflation recipe. Again, I have no way of knowing how this market will respond.
Guess what - no one else does either, in spite of their reckless assertions to the contrary.
"Modest" seems to be the key word to describe global manufacturing growth at the moment. Overnight data out of China and Europe, and then this morning in the US, shows readings above the 50 level ( over 50 is expansion; under 50 is contraction) but nothing spectacular. Equities in particular seem to welcome that news as it is a perfect environment for the bulls - growth, but not fast enough to kick up serious inflation worries. As I type these comments, the S&P 500 just scored another all-time high and the Russell 2000 is once again knocking on the door of its best print ( so much for this index showing signs of fatigue - see that previous post of mine last week).
Copper is not quite sure what to do with the numbers. While copper bulls are glad to see the stronger data, copper bears are of the view that the growth is not fast enough to sustain significantly higher prices for the metal. It did manage a breakout above that resistance zone on its chart and notched a nearly 4 month high today but it appears to be a bit hesitant to extend strongly higher yet. One gets the idea that while sentiment towards copper is markedly improved, that folks are wondering just how much strength in the global economy there is. It may have to wait until this Thursday when we get the payrolls numbers before it makes a bigger move.
For now, while traders may not feel confident enough about it to chase it higher, they look to be ready to buy dips. Chinese double counting and triple counting fears seem to be well in the rear view mirror at this point.
It is interesting to note the action in crude oil in today's session. Brent crude liked the manufacturing data, especially from China, and WTI did as well, but it has faded nearly $1.00/bbl as I am typing these comments up. As I was going over the last COT reports for crude this past Friday, I noticed that the massive, net long position of the hedge funds had been whittled back somewhat. While sentiment towards crude among that group was still extremely bullish, they were pulling some money off of the table. I am watching this closely to see if they will come back in with fresh money at the start of this new month or if they are content to take profits on subsequent rallies higher.
For now, price has stalled up near $107.50 and has retreated to the point of the previous breakout, namely the $105 level. Support extends down from this level towards $104.50. Thus far the market is showing no signs of breaking down as support is holding but with that very large hedge fund long position in this market, any break of a chart support level will get mighty interesting, might fast. Price could fall, in the event of a bout of long liquidation, as far as $103.50 or so and do no damage to the bigger uptrend.
Crude's behavior, along with copper, should tell us a great deal about what big-monied speculative interests are thinking in regards to global and domestic growth.
Grains and beans continued moving lower today. Yesterday's crop condition reports were just icing on the cake as far as the bears were concerned. That earlier report showing the stunningly large bean acreage set the tone and it has been negative since. The corn condition actually got even better ( 75% Good/Excellent) in the conditions report yesterday afternoon.
The chart scored a near 5 month low today.
Finally! We finally got an updated number from the GLD holdings yesterday. It showed a nice influx of some 5.05 tons of gold since the last updated number. That is a nice "positive" strike three. I mean by that, you had the gold price moving higher yesterday, the mining shares moving higher and the GLD showing an increase of 5 tons. That is exactly what one wants to see if they are a gold bull. That, plus the fact that the US Dollar index fell below 80 on its chart.
Gold moved higher in spite of the fact that crude oil moved lower yesterday and the grains imploded. That is even more impressive.
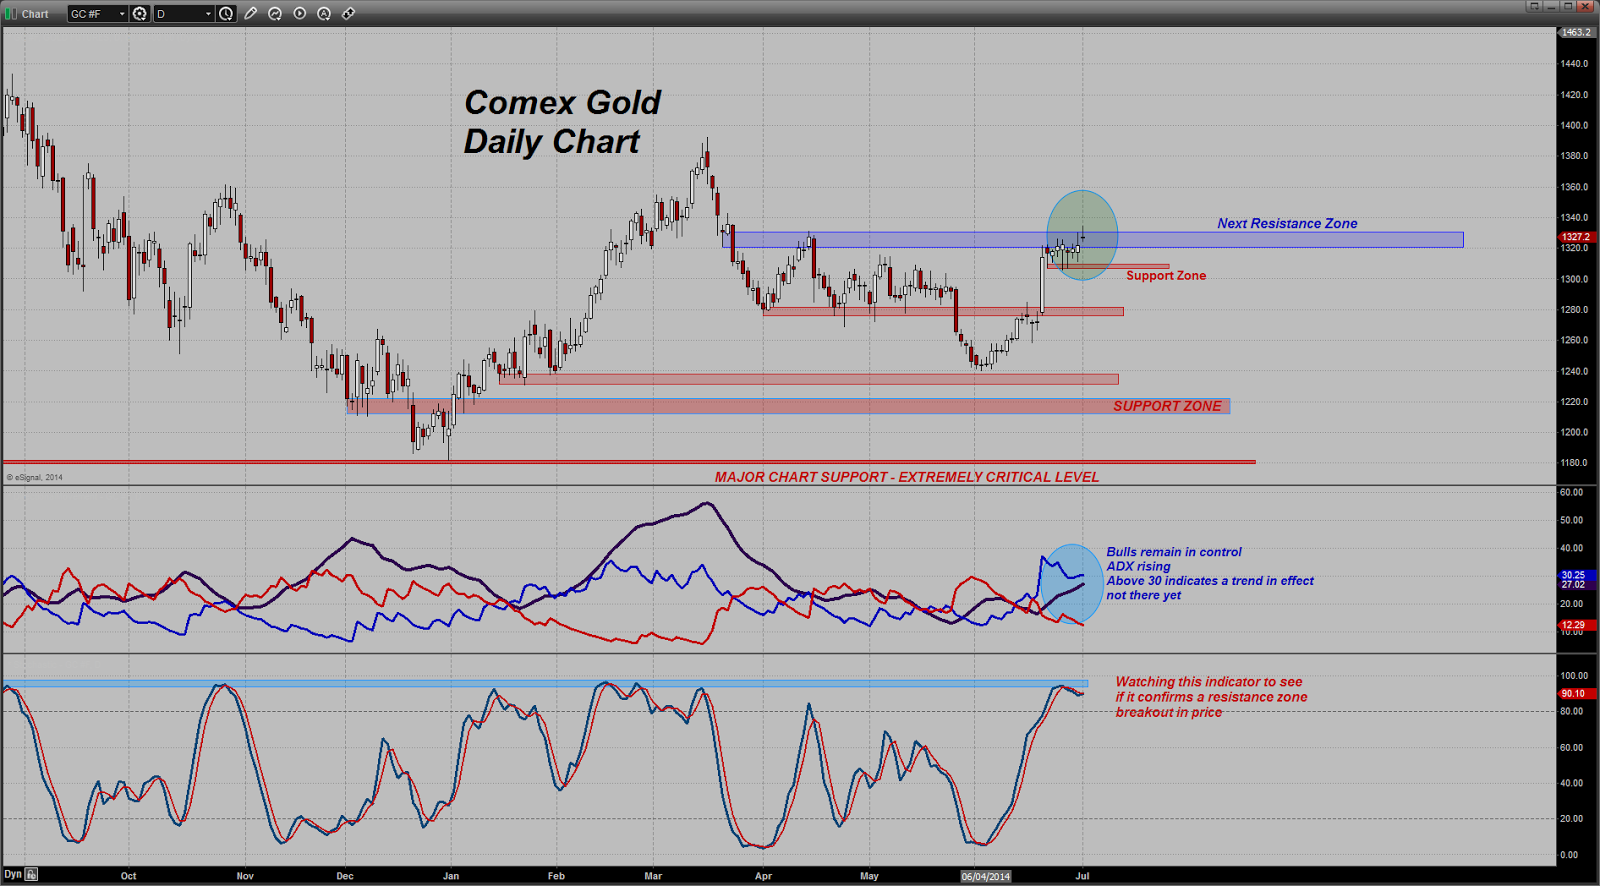
As far as today's price action goes for the yellow metal, it is attempting to break through and away from this resistance zone noted on the chart. Like copper, the market appears to be pausing here to evaluate the current price level. Bulls appear hesitant to get too aggressive while bears are trying to dig in.
If we get a clean push past the top of this zone, the next target is up near the $1360 level. If that were to give way, $1390 comes into play.
I am closely watching the ADX and some other indicators to see whether this market is going to reverse here or will extend. Ranging indicators are near overbought levels commensurate with moves lower in price. However, and this is important, bulls need to push price up to get us to move away from the range trade indicators to the trending indicators. They have not done that yet ( they are close however).
Price could fall back towards $1305 - $1306 and still be okay but bulls would not want to see that fail or it would portend a deeper retracement lower, especially if the market were to lose psychological support at $1300.
For now we wait. Longs - stay sharp here and be alert. One wonders if yesterday's big buyers will return right away or will wait for a dip lower.
Today's USDA reports really did a number on this index that I have created for my own analysis purposes. The unexpected data showed supply outrunning current expected levels of demand and forced the market to adjust to the new set of fundamentals.
If you note the index, it is at a 5 month low!
A couple of things to note here that I was unable to get to this morning amidst the hustle and bustle of trading activity. First, corn demand has fallen off because feed demand is falling off. The reason is because we now know that there are less piggy mouths around to feed than previously expected. Also, cattle numbers are well off last year's levels as well. Less animals to feed means less corn demand.
Secondly, even though planted acreage estimates for corn are lower than last year, traders are expected the harvested crop to actually come in larger than last year. The reason is because we have thus far had nearly ideal growing conditions. The crop looks terrific at this point as it enters the key pollination stage and for now, forecasts look benign.
Wheat prices are low but global supplies are ample and US prices have had to respond to increased competition from other nation suppliers.
I do want to add another note here - today is both the end of the month and the end of the quarter. End of the month positioning is bad enough but throw in a good dose of end of the quarter book squaring, and all manner of strange price moves can be seen.
One look at the chart says it all - Copper is knocking on the door of overhead chart resistance and is threatening an upside breakout.
The catalyst has been continued improvement in recent Chinese manufacturing economic data. Traders are also optimistic that this evening's upcoming overnight release of China's monthly purchasing managers' index is going to be positive.
Also, today's US pending home sales data was a big mover of the market. Sales rose 6.1% in May compared to the previous month. The estimates were for a very modest 1.1% increase. The red metal leapt higher when the data hit the wires as it was much better than expected. Bears were caught off guard by the surprisingly strong number and wasted no time covering.
Copper bulls are banking on improved numbers coming from the two largest consumers of the red metal ( China and the US).
Also, there is behind the scenes talks occurring among banks and traders caught up in the double and triple counting metal schemes to split losses. That seems to have lessened the impact from any expected forced sales of copper in the event that the Chinese authorities force the loans to be called.
It's funny isn't it how one day the market is terrified of losses and then the next day it could care less. Such are the fleeting vagaries of sentiment. One never knows when it will change or what it will decide to focus on from day to day. Let's just say that for now, looking at the chart, Copper is convinced that economic data is going to be improving as we move forward into the summer months.
Let's keep a very close eye on this chart. It is one of the most accurate indicators of global economic activity that I know of.
Today was the big day we grain traders were all waiting for as it was USDA report day. The June Acreage numbers were going to be released along with the Quarterly Grain Stocks numbers. All I can say is "Great Googly Moogly! Look at what USDA hath wrought!".
To say that the report was bearish would be an understatement, especially when it came to the beans. The sheer size of the acreage number ( a stunning 84.8 million acres ) caused traders to gasp in astonishment. This is a record. We were expecting a big number but this was well above the pre-report average estimates. To put it into a bit of perspective - last year 76.53 million acres went to beans. Previous USDA estimates were at 81.49 million acres. No matter how one looks at this report, it is a shocker.
The combination of sky high soybean prices and unseasonably cool, wet weather in certain key corn growing areas, meant that the move to soybeans was strongly underway. Also, the weather in other key soybean growing areas was very good and led to the crop getting in early in some cases.
This report confirms that old but wonderfully time-proven adage; " The best cure for high prices is high prices". Simply put, the market sent the signal that more soybeans were needed and farmers responded accordingly.
If that was not bad enough for the bulls, USDA also came in with an ending stocks estimate that was above the pre-report guesses as well. Analysts were looking for 387 million bushels for carryover but got 405 million instead.
They also gave corn a swift kick in the rear by raising ending stocks estimates to 3.854 billion bushels, well above the 3.724 billion estimates. This is spite of the fact that the big move towards beans among farmers meant less acreage going to corn this year. The agency anticipates 91.64 million acres of corn compared to previous estimates of 91.69 million. To provide some comparison perspective - last year 95.37 million acres went to corn.
While the acreage number for corn, on the surface, seems friendly, ideal growing weather, a huge bean crop and reduced corn demand as evidenced by the 39% increase in ending stocks, gave the signal to the market to take the price lower yet.
This is excellent news for the livestock and poultry industries.
Expected wheat acreage also rose but out of the three categories, the wheat number looks the least negative. KC wheat is actually holding up fairly well given the weakness in SRW and the sharp downdraft in corn.
Farmers can still make money at these prices and hopefully some of them had secured some strategic option positions ahead of the report to give them some downside protection. This particular USDA report is notorious for producing very big and very wild swings in prices. It lived up to its reputation once more.
One side note - in speaking with a reporter over at Dow Jones today on the livestock markets and the reaction of the hogs to the Quarterly Hogs and Pigs report out last Friday, I commented that this USDA report is going to produce a very big shift in Farrowing Intentions for the rest of this year. Hog producer profits look to be outstanding due to these sharply lower feed costs. While most of the hog contracts are locked limit up today having opened that way in some months and remained there for the session at this point, next year should be considered optimistically by hog producers.
To the shell-shocked consumer who is watching gasoline prices moving higher, beef and pork prices soaring and seeing the number of grocery bags that they can bring home for the same price shrinking, at last we have a glimmer of good news on the food cost front. As I have said before, we are going to have to deal with high red meat prices for the entirety of this summer but some relief is still in sight later this year and certainly by next year. (* at least for now! Who knows if the weather will stay this cooperative for the remainder of the growing season!).
Here is a quick look at the November Soybeans Chart about 45 minutes after the USDA report release. Notice that the Head and Shoulders Pattern that was forming on the chart was violently confirmed by the breach of the neckline. Without getting too bogged down in details at the moment, given the time constraint and busy markets I am dealing with right now, the pattern target is down near $11.20 - $11.25. This of course assumes the weather remains friendly.
More later.....
June 28, 1914 - Sarajevo - Archduke Franz Ferdinand and his wife Sophie are shot and killed by a Serbian nationalist. Our world will never be the same.
So might the title have been in the newspapers a century ago. That single act set in motion a profound series of events that culminated in one of the most horrific slaughters our world has ever witnessed.
For those of you who might be history buffs as I am, or for those who are merely curious about a War that forever altered the face of the world as it then existed, I highly recommend you read the following articles in the NY Times which is running with a marvelous series of writings on this human tragedy.
I am not normally a fan of the Times, as it is far too liberal leaning for my likes, but this series of articles is outstanding. They are superbly done!
Every time I read about the sacrifices, and the horrors that those who fought in wars experienced, but especially WWI, I contemplate what it must have been like for those soldiers who fought, bled and died in muddy, wet, miserable trenches with artillery shells, sniper fire and machine gun volleys ripping ceaselessly through the air surrounding them. Far from home and loved ones, many in strange lands, with the shrieks and groans of agony surrounding them, how did they bear up and continue to do their duty? They charged over the top when commanded do to so, knowing full well that the odds favored their deaths shortly as a wall of lead and shrapnel were going to meet them.
It was less than three weeks ago when we were recalling the 70th anniversary of D-Day in WWII. It is humbling to consider that we are now 100 years removed from the tumultuous events of a bygone era.
Sometimes it is good to pause and reflect on such things.
http://www.nytimes.com/2014/06/27/world/europe/world-war-i-brought-fundamental-changes-to-the-world.html?action=click&contentCollection=Europe&module=RelatedCoverage®ion=Marginalia&pgtype=article
I have mentioned in the past that I would keep the readers up to date on the TIPS spread action, especially as it compares to the gold price. I have the data through Thursday of this week ( the Federal Reserve is always a day behind in getting the fresh data) but it does continue to confirm the idea that the broader market is still continuing to see inflationary pressures increasing, albeit at a controlled rate. I believe that this is linked directly to the recently dovish attitudes of three Western Central Bank heads - ECB President Trichet, who got the ball rolling with a reduction in rates in the Eurozone as well as engaging in negative rates for bank reserve deposits, Fed Chair Yellen and BOE Head Carney.
The TIPS spread remains near the highest level in 6 months, a positive key that is keeping gold supported recently. We need to also keep in mind that another of the factors that goes into determining the gold price is also a premium due to the geopolitical factors that might or might not be present. At the current time, the chaotic events in Iraq are undergirding the price of the metal. Lurking around also, although much less of a factor, are events in Ukraine.
The point I want to make here is that inflationary expectations might actually be falling at some point as signaled by the TIPS spread, but geopolitical events could be dominating trader/investor sentiment and such concerns could supercede any signal from the TIPS spread. If figuring out which way markets are going to go, or what the sentiment might be at any given time, were as easy as just looking at one input, we would all be living on our own S. Pacific islands.
Here is the chart update through Thursday.
Along this line, here is the current chart of the Goldman Sachs Commodity Index. As of the close of trading this week, the index is up almost 8% on the year.
From a broader perspective, it continues range bound as noted by the shaded rectangular region on the chart.
That brings me to the US Dollar. It too is range bound. Notice that there exist two defined trading ranges on this longer-term weekly chart. The first and large range has been in effect for a year now. It extends up towards 84 on the top and down towards 78.60 on the bottom. Within this range, is a shorter and narrower one which extends towards 81.50 on the top and near 79 on the bottom. The latter range has kept the Dollar confined for the past 8 months or so.
The relationship between the US Dollar and the broader commodity complex remains fairly consistent which is why the chart pattern for the commodity index and the Dollar index are both showing range bound markets for the time being.
The stock indices did what they have done for so long now - every time they appear to be rolling over, back up they spring. Equity bulls are not going to give up without a fight. The benchmark Russell 2000, a good indicator of investor sentiment towards risk, was up nearly 0.75% today and managed to close higher on the week, after looking like it was finally going to show some downside follow through from weakness earlier in the week.
The index remains well above its 50 day moving average after dipping down into that level last month.
While one can make the case for bearish divergences showing up, this index has continued to shrug off one divergence after another for over a year now!
One last thing ( for now ) I believe it was last week when I mentioned the Gold Commitment of Traders report noted that there was a considerable amount of short covering that occurred in the drive higher coming off of Janet Yellen's dovish remarks back then. Hedgies were caught off guard by that ( as was nearly most everyone else!) and headed for the exits in a big way. They covered around 16,600 short positions against only adding around 1700 new long positions.
I remarked last week that if one is bullish gold, they want to see any move higher in the market accompanied by the infusion of new money from powerful speculative interests and not merely short covering, which while it can be impressive, tends to fizzle out as quickly as it starts.
This week was a welcome change therefore for the bulls in that department. The buying from the hedge funds became much more balanced this week. Short covering was still the dominant feature among that category to the tune of some 24,800 shorts being lifted but here is the noteworthy development - they added nearly 23,000 new long positions. Can you see the difference from the previous week?
Also, this new buying ( dip buyers ) are the reason that gold is currently hanging quite tough up here. It has been stymied at the $1320 level but it is not setting back much at all. This is what steady determined buying does. It keeps a market supported on dips in price. Bulls will want to see this pattern continue. The last thing that one wants to see if they are bullish is for the longs to STOP BUYING these dips. We will know it very quickly if they do just that by the price action.
The events in Iraq, the rising TIPS spread, the lack of strong bullish conviction in the US Dollar at the moment, are all providing some wind at the back of the bulls.
That being said, gold seems to be looking for a catalyst to power it up through $1320 and allow it to maintain its hold ABOVE this key level. With today's momentum driven markets, any sign that the upward momentum has stalled will get touchy, jumpy short-term oriented longs very nervous. Gold bulls will therefore need to prove their meddle next week. Lacking a fresh catalyst, gold's inability to quickly put $1320 in its rearview mirror, is going to embolden the bears. While bulls are certainly digging in on these dips, bears are also digging in here at this level.
In spite of the strength being shown by gold, some of the big investment banks and their advisory services are still coming out with bearish second half of the year calls on gold. The reason - they expect the economy to continue to improve and interest rates to rise early next year. I am not sure about that prediction but it is basically the same expectation that stock market bulls are relying on. We'll see if it is correct or not.
Lastly, here is the current chart of the GLD holdings. The reported holdings at 785.02 tons has not changed since the beginning of this week. Maybe we will get something new over the weekend or early next week. I sure hope so - these guys are slower than molasses on a winter day in getting us new data to work with.
Compared to exactly one month ago, total reported tonnage is down .26 tons. For the year, holdings were at 798.22 at the start of 2014. Doing the math we get gold tonnage down 13.2 tons for the year thus far. Western-oriented gold bulls are going to need to do much better than this.