"When misguided public opinion honors what is despicable and despises what is honorable, punishes virtue and rewards vice, encourages what is harmful and discourages what is useful, applauds falsehood and smothers truth under indifference or insult, a nation turns its back on progress and can be restored only by the terrible lessons of catastrophe." … Frederic Bastiat
Evil talks about tolerance only when it’s weak. When it gains the upper hand, its vanity always requires the destruction of the good and the innocent, because the example of good and innocent lives is an ongoing witness against it. So it always has been. So it always will be. And America has no special immunity to becoming an enemy of its own founding beliefs about human freedom, human dignity, the limited power of the state, and the sovereignty of God. – Archbishop Chaput
Trader Dan's Work is NOW AVAILABLE AT WWW.TRADERDAN.NET
I thought this would make a good quip but the fact is that it is true. The Dollar is once again getting whacked, thanks mainly to ECB President's rather rose-colored glasses prognosis of the Eurozone economy. Then again, what is he supposed to say: "the unemployment rate among the youth is approaching critical mass but what the heck do we care about that? Most of us will be dead and long gone by the time it goes kaput. Hey, things could be worse so lighten up and relax a bit"?
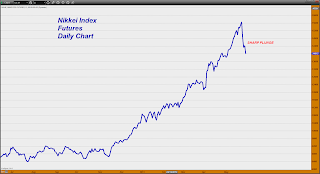
If you want to see two charts that pretty much tell it all, take a look at the Nikkei and the Japanese Yen.
The Nikkei futures have dropped 17% in less than a month! That is mind-boggling to me.
Now look at the Yen.. it has staged a 7% rally over that same time period and is having a monster day to the upside today. It was up nearly 3% at one point during this trading session alone!
What you are seeing taking place is now a reversal of the Yen carry trade in which money was borrowed in Yen terms and leveraged into stock buys for even greater gains. The rally in the Yen has caused these highly leveraged trades to disintegrate and that is causing a ripple effect across the currency markets and the equity markets as those trades in which every mother and their dog was long the US Dollar and long global equities and are now trying to exit those trades. That is why we are seeing the Dollar being crushed and is also the reason we are seeing gold moving higher.
Remember, the big trade was to sell gold and take that money and put it into equities. When the equity markets begin breaking down, money flows out of that sector and back into gold while the Dollar breaks down.
Interest rates on the Ten Year, which, a week ago, were near 2.2%, today fell below 2% at one point. I repeat something which I have said over and over again at this site. This bond buying, QE, easy money policy being followed by the Fed has created the most insane volatility I recall ever witnessing in the totality of my entire trading career. I pity the poor risk manager at a mortgage company, an insurance firm, a pension fund, etc. trying to institute hedges to mitigate risk for his/her firm. There is not a single person on the planet who can read this madness and project where this is going more than one day in advance! Imagine trying to decide which side of the market you are supposed to get protection from in this sort of environment!
Tomorrow we get another payrolls number so this incessant, unprecedented volatility will just continue if not become even more exacerbated. Sigh....
I might make a note here to say, this is what I expect will eventually happen to gold at some point down the road when this monetary experiment in unlimited money creation has proved to be an ultimate failure. The investment world has been herded and corralled into all taking the same side of the same trade knowing that they are being backstopped by the Central Bankers. Once the realization dawns upon them that not a single structural problem has been solved and that the entire "recovery" depends on more crack cocaine being shoved into the victim to ward off the withdrawal symptoms, faith in the almighty Central Banks is going to evaporate.
Case in point is what is going on in Japan. The initial euphoria about the bold new monetary and political reform plan to boost the Japanese economy has rapidly soured. Skepticism is rising and with it, caution, and the desire to not be the one left looking for a chair in which to sit when the music finally stops playing.
Gold has been up and down like a damned yo-yo. Until it can strongly clear $1420, it looks as if the rallies continue being sold. However, the longer this market refuses to break down, the more nervous the bears are going to become and will begin to look for an exit. Keep in mind that while short covering is not enough to build a lasting rally upon, ALL REVERSALS IN DOWNTRENDS BEGIN WITH SHORT COVERING. The test then becomes whether or not NEW MONEY flows into that market. If it does, the trend reverses; if it does not, the market moves lower once the short covering evaporates and runs its course.
Up, Down; Up, Down; Up, Down... On and on it goes. Today's big market moving data was the ISM manufacturing number. It came in under 50, surprising nearly everyone on the planet. As a matter of fact, the reading at 49, was the lowest since June 2009! That is saying something indeed.
As soon as that number hit the wires, the currency markets erupted in a turmoil. The usual knee-jerk reaction hit Dollar/Yen and up went the "safe haven" Yen (I still have a hard time putting those words together in one phrase for the sheer idiocy of the rationale behind it), up went the Euro and down plunged the US Dollar, falling through a strong support level I might add.
Here is the problem - the entire world is long dollars. Take a look at the following Chart of the Commitment of Traders in the Greenback. Notice I am not posting the usual breakdown which is the Disaggregated Report for simplicity's sake. Just look at the specs, both the large ones and the small ones. This is what can happen when that group is all crowded together on one side of a trade and a chart level gets taken out. There is literally no one to take the other side of their buying or selling, in this case selling.

What that weak ISM number did was to once again put a temporary halt to the idea that the Fed was going to imminently begin the "tapering" of their bond buying program. That was all gold needed to hear before it reversed its downside reversal on Friday, from its upside reversal on Thursday of last week. In other words, the YO-YO market is acting like a YO-YO with its fortunes tied to both the US Dollar and the QE program. With the Dollar breaking down, gold is breaking up. It really is that simple. Now, if we get one of those strong payrolls numbers again...well, you figure it out.
Gold still needs to clear $1420 to get a larger wave of short covering among that hedge fund category. ideally that will occur against a backdrop of a push PAST 290 on the HUI, preferably through 301. They are still selling rallies but if the technicals continue to improve on the gold chart, their algorithms are going to start lifting them off of the short side. The bias in the gold chart is still down and will be until gold can push past $1440.
It will be interesting to see how the specs react to GLD this week. I am curious as to whether they are going to start returning to the buy side or will merely use this rally to further jettison their gold holdings. Keep in mind that there are a lot of money managers out there who still want to buy dips in stocks, whether here in the US or in Japan. They are going to raise funds to do so where and when they can so the onus is on the gold bulls to prove that this is more than a rally back to the top of a trading range market.
Traders and Hedge Fund Managers continue to monitor the largest gold ETF, GLD, for clues to its next direction. For the entirety of this year, 2013, the amount of tonnes of gold in GLD has been dropping - rather sharply at that.
Regardless of where this gold is going, and that is indeed a legitimate question, the facts are that hedge funds, which are the drivers of today's markets, are leaving GLD in droves and taking those funds to play with equities where the big returns are currently coming from.
I would watch to see if this drawdown of gold stores in GLD shows some sign of abating before getting too bulled up about gold. Please see that Goldman Sachs Commodity Index chart that I posted earlier today. One cannot make much of a case for inflationary pressures building in the economy when the commodity complex is not confirming it!
If you look at that chart, and look at this chart, you can see that the biggest speculators on the planet are currently not at all enamored with gold the way that they had once been. When they fall in love with the metal again, and we will know that by monitoring this chart, we will see the results in higher prices that are sustained alongside of dip buying on price retreats. Currently we have specs SELLING RALLIES in gold and covering on moves into support levels when it appears that support will not give way.
Meanwhile, we continue to see many in the gold community continuing to remain stubbornly, wildly bullish. This is more wishful fantasy than solid analysis. Expect a broken clock to be correct at least twice a day. At some point the gold bulls will have their day. Those who have to trade for a living however would do better to try to ascertain the future actions of the hedge funds, because it is that group which will drive the gold price. As long as they are in a selling mood, rallies will not stick.
What is needed is something that changes the complexion of the technical price charts. When that occurs, the computer algorithms of the hedgies will return to buying. Then and only then can we get excited about a SUSTAINED move higher in gold.
One of the greatest mistakes many would-be traders make is allowing emotions, hopes, wishes, etc. to cloud their judgment of what currently is. Wishful thinking is not a trader's friend. If you want to survive in these markets, and prosper, you must become a hard-nosed realist able to master your emotions. Show me an emotional trader, and I will show you another failed statistic. Trading is a business. Treat it that way. Get control of your emotions, both wild-eyed optimism and excessive pessimism. Neither of these are your friend. Read the price action from the chart and then form an opinion. Far too many form their opinion and then go the price chart and try to make IT (the price chart) conform to their opinion. Novices do this and fail. Professionals do not. The play the cards that are dealt to them.
Following is a weekly chart of the Goldman Sachs Commodity Index or GSCI. Notice the large red line moving from left to lower right. That indicates the general overall trend of the sector which as you can clearly see has not been bullish.
What you are seeing here in graphic form is the result of money flows OUT of the sector by large speculative forces. That money is of course flowing IN to equities.
I am not sure what it will take for this trend to reverse but until it does, upside rallies in silver are going to be difficult to sustain.
One thing you might also notice is that there seems to be a decent base of support between 575-550 on this chart. My take on this is that while the overall complex is moving lower in price, certain sectors within it seem to be near values that would indicate that there is not a lot of additional downside left. Determining exactly what those sectors are takes a great deal of fundamental research and well as comparing chart action to those findings.
What this means is that while we are a long way from seeing sharp upside rallies and SUSTAINED uptrends in the complex as a whole, certain individual markets may merely grind sideways to slightly lower for the foreseeable future until something happens to arrest this general development.
For investors with a longer term time frame (notice, I am not saying 'traders'), we might be nearing the cost of production in some commodities meaning that your downside is limited.
I would also add a caveat here; if that base at 550 were to give way for any reason, look out, because the deflationary forces would be reasserting themselves. If that were to occur, and I would be very surprised if it did, expect for the bond market to reverse course and for rates to start dropping once again.
Please click on the following link to listen in to my regular weekly radio interview with Eric King over at the KWN Markets and Metals Wrap.
http://www.kingworldnews.com/kingworldnews/Broadcast/Entries/2013/6/1_KWN_Weekly_Metals_Wrap.html
In this case it might be better written, "FOMC, we have a PROBLEM!"
What I am referring to is the long awaited and long expected, I might add, breakdown in the US long bond. It is my opinion that the US bond market is the single most important market on the planet. For years, many of us have sat and watched as bond prices were driven to levels that very few thought imaginable a decade ago. What with the rush into the perceived "safety" of US Treasury debt and the concerted effort by the Federal Reserve to drive down long term yield through their Quantitative Easing programs, bond bears were blasted from one defensive position after another by the steady influx of money flows.
My oh my how things have changed over the last few weeks! I give you a weekly chart of the long bond where you can see the breakdown in vivid terms. With the advantage that comes from some hindsight now that enough time has passed to trace out a definitive chart pattern, we can see the peak in the bond market, and the low in long term interest rates has come and gone. Do you see that MAJOR TOP that form over the course of most of last year? Three times the bonds were shoved into that region and three times they failed there. The third time turned out not to be a charm and out went speculative money to giddily chase equities as this bond bubble burst and the new one formed in equities.

Once the major support level gave way near the 145 level, a countertrend rally developed that took bond prices through NINE handles before speculators could see that the final rally to retest the former peak could not muster enough strength to move the final 4 handles needed to reach it. Down she went and up went long term interest rates as a result.
I want to point out something on this chart that is more a function of the rolling process that occurs in the futures markets but nonetheless leaves it mark upon the technical price charts. This week the front month bond contract became the September bonds. Prior to this changeover it was the June bonds. There is currently a FULL ONE POINT DIFFERENCE between the value of those two contract months. When a continuous contract is drawn out for analysis purposes, the data it will include always contains the FRONT MONTH contract or the most active. That has now become the September Bond contract. When this is included, you can see the impact on the technical price chart!
Note how the support level that formed where the counter trend rally began, has now given way because of the level at which the September bond contract is currently trading.
The day is not over yet and thus neither is the week, but barring a late session upside movement in the bond market, it is now on track to close below what has been a significant chart support level. If it does so, odds favor a furthering of the new trend to the downside with no significant chart support showing up until another 3 - 31/2 points lower down near the 136 region.(Maybe the boyz at the Fed will send their New York desk buyer to the market to buy some bonds later today....)
One has to wonder if this is what the Fed had in mind when they were attempting to push long term interest rates lower. What they got was a mad rush out of bonds and fixed income in a near ZERO interest rate environment and into equities. All that money flowing out of bonds in search of easy gains in equities has now resulted in a surge higher in interest rates at the back end of the curve.
It is no secret that the formula for the current "recovery" has been ultra low interest rates which have made debt servicing easier for business, consumers and the government I might add. The big question is whether or not this nascent recovery can stand a rise in interest rates. I do not believe that it can. So where does that leave the Fed?
Talk of tapering QE makes investors nervous and actually undercuts any reason to buy bonds since a major buyer has been removed if that were to occur. That engenders selling. On the other hand, if the Fed were to actually reverse course and RAMP UP bond buying once again if the economy were to slow, then all that would do is to further facilitate the bubble in the equity markets that they have created. Money flows would continue to exit bonds and find a home in equities. Either way, bonds suffer as a result and head lower.
Talk about a self-inflicted conundrum! Good luck with this one fellas... You made it; now handle it!
For those of you who might be interested in a story dealing with a proposed buyout of giant US pork producer Smithfield, by a Chinese controlled firm, Shuanghui International, you can check it out at the following link. The radio interview is three minutes so you can get the gist of what is happening in a short time.
There is also a write up if you prefer to read that instead.
While I tend to devote most of my writings at this site for gold, currency and interest rate related topics, I cut my trading teeth on the ag markets and still consider them my favorites. The Grains and the Livestock markets and I go back a long way together!
http://www.npr.org/blogs/thesalt/2013/05/30/187163300/will-chinese-firm-bring-home-the-bacon-with-smithfield-deal
It looks as if we have FINALLY got some sort of catalyst to propel gold through that big round number overhead resistance level at $1400. Based on what I am seeing this morning, it began with the steep slide in the Japanese stock market, with further help from the very disappointing GDP growth number that came out this AM.
To start - the Nikkei fell 5.2% on Thursday, as investors over there are suddenly having concerns about the overall effectiveness of the "inflation" program that has been implemented by the political and monetary authorities. That fall in stocks resulted in a strong safe haven bid into the yellow metal. Keep in mind, that heretofore investors have chosen to ignore gold or outright sell it short as they put investment capital to work in better returning equity markets. If anything upsets that apple cart and begins to cast the least bit of doubt that the strategy is not going to be effective moving forward, we will see money flow out of stocks.
Secondly - the US economy was revised downward in growth for the Q1 2013 from last month's reading. Instead of the 2.5% reported last month, the number was revised lower to 2.4%. That took some of the steam out of the "TAPERING" talk that has been everyone of late. As most of the readers of this site are aware, gold has been under pressure ever since that TAPERING talk began to gain some credence. Today's revision was a reminder that this economy remains quite weak with tepid growth and is still very susceptible to downward pressure. Growth numbers will need to do more than this to provide any factual basis for a curtailing of the Fed's QE program.
I should further note here that the "deflator" number that was used by the BEA was 1.18%. The BLS has a December-March inflation number of 2.10%! That is no mean difference! The lower the deflator number used (another way of saying this is that the lower the rate of inflation employed by the statisticians), the better the headline number for growth comes in. IF the BLS number had been used instead of the 1.18% reading, the growth reported would have been even lower!
The mining shares are showing some welcome signs of life of late. As you can see on the chart below, they gapped higher today but until this index closes through that gap region indicated, I cannot get too excited about their future prospects. To pique my interest, I would need to see two consecutive closes through at least the 290 level. Still, it beats seeing the things dropping to new lows every day! Obviously value buyers are active but we need momentum based buyers to chase these things like they have chased the broader equity markets. That will require a technical chart confirmation that the trend is ready to reverse.

There was some news out the other day about the US Dollar losing a bit of its demand as the chief currency for global reserves. The IMF data on that was interesting. I do not know if that might have had something to do with the weakness that we saw yesterday and are seeing again today, but for whatever reason, the Dollar just took out at least one downside support level on the chart.
I am using a 4 hour chart as it shows the support level more clearly than just the daily chart. You can see the breach of that level was accompanied by a pretty decent spike in volume which is bearish. The week is not over yet but if the Dollar cannot climb back over that support, odds would favor additional downside early next week.
Don't forget the entire world is LONG DOLLARS and the trade is extremely crowded both among the big hedge funds and the general public. If any more downside technical levels were to get taken out, we could see some pretty serious selling occur in the greenback.
Obviously, any weakness in the US Dollar is going to benefit gold, which is exactly what we are seeing occur so far in today's trading session.
Speaking of gold, clearing $1400 is a big deal on account of that fairly hefty hedge fund short position. We did see some short covering occur on the move through this level. My analysis suggests heavier short covering will occur if the metal can push PAST $1425 with a serious unwind of short positions if price can clear $1440. For analysis purposes, we should start to focus on the August gold contract as the June is entering its delivery period and open interest in that contract month is rapidly dropping. It will also be interesting to note the delivery process itself and see what kind of offtake occurs.
Silver is getting some help from the strength in gold today and the bit of strength in copper is not hurting it either. Until that market clears $24 I cannot get excited about it.
The yield on the Ten Year Treasury note has been all over the place today. Volatility in the US bond markets, while nothing like the madness that has been unleashed in the Japanese government bond markets, is definitely increasing. Interest rates that begin wild oftentimes unpredictable movements have the potential to destroy hedging programs put in place by any entity with interest rate exposure. This is especially true of insurance companies and mortgage companies. Things can get out of hand very quickly and become quite ugly if money flows start getting erratic in that critical sector.
If you want to know how bad it can get, just look at what the Japanese monetary authorities are having to do in order to try to calm the jitters in their bond markets.


