Dow Jones is reporting this morning that PIMCO's Commodity Real Return Strategy Fund, with about $20 billion in assets, has raised its gold holdings to 11.5% of it total assets from 10.5% two months ago. The position was apparently taken when gold dipped towards $1500 according to comments from Nic Johnson, its co-portfolio manager.
Their concern is a triple one - loose monetary policy, high levels of sovereign debt and rising commodity prices are going to fuel an inflation outbreak as we move ahead.
Sounds familiar doesn't it?
Here is the point - the chart in gold showed tremendously strong support in gold on any retreats in price down below the $1600 level a short while back. Gold would dip down into these levels but would immediatey attract strong buying and would rebound back higher. WE remarked that this sort of chart action showed ACCUMULATION by deep-pocketed players, whether those were of Asian origin or large investment funds elsewhere. REgardless, these well capitalized players are positioning themselves for what they see coming down the road.
Note, that this is not MOMENTUM BASED buying. That crowd only enters the markets AFTER it starts moving higher and takes out technical resistance levels. They are now coming into gold and into silver. ACCUMULATION puts a floor in a market; momentum based buying drives it higher into a trend.
We'll need to keep a close eye on the yield on the Ten Year Note to see how that acts as we move forward. If the inflation play is replacing the deflation play, we have seen the lows in interest rates for a very long time.
Wednesday, August 22, 2012

Tuesday, August 21, 2012
Grain Prices Remaining at Lofty Levels
Word out of the crop tour this AM has sent both corn and soybean prices strongly higher dragging wheat along for the ride.
The supply seems to keep shrinking as each successive yield estimate comes in with a lower number. Once the market comes to grip with the actual supply number for this year, the focus will shift to the demand side of the equation and whether or not the market is doing its job of rationing supplies.
One thing is for certain - we, the consumer, are going to be reeling at the grocery store very soon.
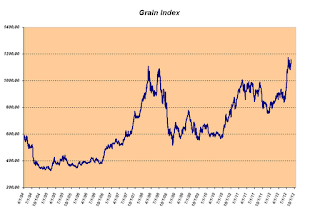
Take a look at my Grain Composite Index - if you thought grain prices were high back at the peak of the commodity bubble in 2008, you ain't seen nuthin' yet! The Index is firmly above that level.
The strong day in the grains, combined with big moves in both gold and silver and another bullish call on oil from Goldman Sachs, has sent the CCI, the Continuous Commodity Index, through the top of its recent trading range. If the CCI does not surrender its gains before the end of the week and remains above that resistance level, from a technical analysis perspective, the trend in commodities will have shifted to UP.
Note how the top of this recent trading range has been in the same zone as the 61.8% Fibonacci retracement level. That makes today's move even more significant. I do not see much in the way of overhead resistance past this point until we get closer to 582 - 585 in this index.

Shifting a bit to the mining sector stocks - the HUI has pushed past 440 and is maintaining its gains as of this hour. It is on course to make a try at heavy resistance centered near 460. If the HUI closes a week above this level, it portends a trending move to the upside which would initially target 540 -555.

Silver has cleared heavy resistance at 29 and is closing in on the last level of chart resistance between it and a handle of "30". If it does that, look for the momentum funds to come piling into this market.

The supply seems to keep shrinking as each successive yield estimate comes in with a lower number. Once the market comes to grip with the actual supply number for this year, the focus will shift to the demand side of the equation and whether or not the market is doing its job of rationing supplies.
One thing is for certain - we, the consumer, are going to be reeling at the grocery store very soon.
Take a look at my Grain Composite Index - if you thought grain prices were high back at the peak of the commodity bubble in 2008, you ain't seen nuthin' yet! The Index is firmly above that level.

The strong day in the grains, combined with big moves in both gold and silver and another bullish call on oil from Goldman Sachs, has sent the CCI, the Continuous Commodity Index, through the top of its recent trading range. If the CCI does not surrender its gains before the end of the week and remains above that resistance level, from a technical analysis perspective, the trend in commodities will have shifted to UP.
Note how the top of this recent trading range has been in the same zone as the 61.8% Fibonacci retracement level. That makes today's move even more significant. I do not see much in the way of overhead resistance past this point until we get closer to 582 - 585 in this index.

Shifting a bit to the mining sector stocks - the HUI has pushed past 440 and is maintaining its gains as of this hour. It is on course to make a try at heavy resistance centered near 460. If the HUI closes a week above this level, it portends a trending move to the upside which would initially target 540 -555.

Silver has cleared heavy resistance at 29 and is closing in on the last level of chart resistance between it and a handle of "30". If it does that, look for the momentum funds to come piling into this market.

Monday, August 20, 2012
Stealth Mode Rally in Silver Maybe not so Stealthy Anymore
I remarked last week that silver had been slyly working its way higher in very quiet fashion but was knocking on the door of overhead resistance. Today it broke that resistance and so far is doing it in convincing fashion.
Based purely on technical factors, it should try to make a run at $29 where heavier supply awaits. That stands between it and a handle of "30" which will most certainly catch the attention of the momentum crowd.
Take a look at the shorter term moving averages (not labelled). These are the 10 day and 20 day respectively. Notice that late last week BOTH MOVING AVERAGES crossed above the longer term 50 day moving average. This has not been the case since the middle of March of this year! Also notice that both of those are now trending in an upward direction as they pick up the upward shift in momentum.

You will also see the heavier blue line which is the 100 day moving average. That comes in near 28.83, a bit below horizontal resistance near the 29 level. Expect a battle beginning at that level and extending up to $29. This is one of the reasons I expect to see a fairly large amount of supply hit the market near this point. If the silver bulls can eat through and absorb that selling, it will mark a decided shift in sentiment towards the metal.
Downside support lies first near $28 and is staggered at 50 cents intervals below there down to $27.
I should note that this is occuring against a backdrop of a higher CCI (Continuous Commodity Index) which is beginning to move closer to the top of its recent trading range. Note also that this top of the recent trading range happens to correspond EXACTLY with a criticial Fibonacci Retracement level, namely the 61.8% near 566.
If the CCI can clear 570 with gusto, Silver will see an increase in buying.

Based purely on technical factors, it should try to make a run at $29 where heavier supply awaits. That stands between it and a handle of "30" which will most certainly catch the attention of the momentum crowd.
Take a look at the shorter term moving averages (not labelled). These are the 10 day and 20 day respectively. Notice that late last week BOTH MOVING AVERAGES crossed above the longer term 50 day moving average. This has not been the case since the middle of March of this year! Also notice that both of those are now trending in an upward direction as they pick up the upward shift in momentum.

You will also see the heavier blue line which is the 100 day moving average. That comes in near 28.83, a bit below horizontal resistance near the 29 level. Expect a battle beginning at that level and extending up to $29. This is one of the reasons I expect to see a fairly large amount of supply hit the market near this point. If the silver bulls can eat through and absorb that selling, it will mark a decided shift in sentiment towards the metal.
Downside support lies first near $28 and is staggered at 50 cents intervals below there down to $27.
I should note that this is occuring against a backdrop of a higher CCI (Continuous Commodity Index) which is beginning to move closer to the top of its recent trading range. Note also that this top of the recent trading range happens to correspond EXACTLY with a criticial Fibonacci Retracement level, namely the 61.8% near 566.
If the CCI can clear 570 with gusto, Silver will see an increase in buying.

Saturday, August 18, 2012
Trader Dan on King World News Markets and Metals Wrap
Please click on the following link to listen in to my regular weekly radio interview with Eric King on the KWN Markets and Metals Wrap.
Friday, August 17, 2012
Ancient Rome had Nothing on Modern Day America
Historians have chronicled the decline of the Roman Empire detailing in great extent the internal rot and moral decadence that helped speed its eventual fall. The lack of ethics and virtue was bemoaned even in those days by some of its leading philosophers/statemen.
I find it therefore rather disconcerting to see the the eerie parallels between the symptoms of rot and decay prevalent in Rome before it fell and the current US financial system, which has become a cesspool/stinking outhouse in terms of any vestige of decency and integrity.
Witness the case of one Jon Corzine, which if there was any semblance of justice and virtue left in the current administration's Justice department, would have swiftly be sent to prison where he could play "drop the bar of soap" with his fellow inmates.
With that in mind, take a look at the following article and see if you can constrain your feeling of righteous revulsion.
I find it therefore rather disconcerting to see the the eerie parallels between the symptoms of rot and decay prevalent in Rome before it fell and the current US financial system, which has become a cesspool/stinking outhouse in terms of any vestige of decency and integrity.
Witness the case of one Jon Corzine, which if there was any semblance of justice and virtue left in the current administration's Justice department, would have swiftly be sent to prison where he could play "drop the bar of soap" with his fellow inmates.
With that in mind, take a look at the following article and see if you can constrain your feeling of righteous revulsion.
Guilty As Sin And Free As A Bird – Corzine Edition
He Simply Doesn’t Know Where The Money Is, But He’s Bored And Feels Like Starting A Hedge Fund
Hey, I’ve got good news and bad news this fine and wonderful morning. The good news is that there may well be a new investment opportunity for those of us eager to improve our financial means. The bad news is that it consists of a hedge fund run by none other than Jon “I simply do not know where the money is” Corzine.
Thursday, August 16, 2012
HUI Chart
The Mining Sector shares have shown some strong performance over the past three weeks having solidly rebounced from down near 390 moving up through several overhead resistance levels.
A push through overhead resistance near 440 sets up a run towards a major resistance level centered near 460, which is the point that needs to be bested for a trending move to the upside to develop.

A push through overhead resistance near 440 sets up a run towards a major resistance level centered near 460, which is the point that needs to be bested for a trending move to the upside to develop.

Silver Quietly Sneaking Higher
Silver has managed to rally right to the top of its consolidation pattern without any fanfare and I should add, the participation of a great deal of managed money flows. In other words, without the benefit of the momentum crowd. CAll it a type of stealth rally.
I find this very interesting as it is occuring against the backdrop of rising Treasury yields and a rising equity market. Clearly, for whatever the reason, something seems to be occurring on this inflation front that is moving below the radar screen of many investors. Could silver be sniffing out the first whiff of an inflation play?
Take a look at the following chart and note that the shorter term moving averages, the 10 day and the 20 day, are now trading either ABOVE the longer term 50 day or near par with it. This is a big change that has not been seen on this chart since early March of this year! That is quite astonishing! Keep in mind that hedge funds, while they remain overall net longs, have drastically reduced that position and had actually been adding some fairly large short bets. EVen with that, someone is buying this metal and very quietly pushing it higher.
Let's keep a very close eye on this as it could portend a strong upside move if it can solidly clear the overhead resistance noted on this chart, especially if it does that to end a week of trade.

I find this very interesting as it is occuring against the backdrop of rising Treasury yields and a rising equity market. Clearly, for whatever the reason, something seems to be occurring on this inflation front that is moving below the radar screen of many investors. Could silver be sniffing out the first whiff of an inflation play?
Take a look at the following chart and note that the shorter term moving averages, the 10 day and the 20 day, are now trading either ABOVE the longer term 50 day or near par with it. This is a big change that has not been seen on this chart since early March of this year! That is quite astonishing! Keep in mind that hedge funds, while they remain overall net longs, have drastically reduced that position and had actually been adding some fairly large short bets. EVen with that, someone is buying this metal and very quietly pushing it higher.
Let's keep a very close eye on this as it could portend a strong upside move if it can solidly clear the overhead resistance noted on this chart, especially if it does that to end a week of trade.

Wednesday, August 15, 2012
Are we Witnessing a Shift in Investor Sentiment?
As many of you who listen in to my regular weekly radio interview on the KWN Markets and Metals Wrap are aware, in my mind, the most important financial market is the bond or interest rate market. Everything revolves around interest rates and as such, those levels are the key in understanding where traders/investors are in their thinking at any given moment in time.
Take a look at the following chart denoting the interest rate being paid or the yield on the US Ten Year Note. Within the span of a mere 3 weeks or so, this yield has shot up from down near 1.4% all the way to 1.8%. That is a very rapid shift. It is now sitting at levels that we have not seen since the middle of May of this year.
From a technical analysis perspective, it has reached an inflection point. ON the way down, this 1.8% level, held the market in check back late last year and early this year. Once it was broken to the downside in May, it subsequently tried to rally back above that level but failed. From that point on, it was straight downhill.

Now it has regained this level. Where it closes this week is going to be critical to our understanding of where things are headed in the following weeks. Apparently, investors have moved past the European debt crisis in their thinking (at least for the present). Something has gotten their attention to the point that they are pushing up interest rates.
Now, whether the Fed is particularly happy with this remains unclear but one has to suspect that the last thing the Federal Reserve wants to see is these longer dated rates getting too far out of hand. Also, keep in mind that the higher these yields move, the higher the cost of servicing the gargantuan, humungous, mind-boggling, stupendously large (how's that for superlatives?) US federal debt burden will become.
Given the mediocre condition of the US economic recovery, it is difficult for me to envision yields breaching this overhead resistance level. Still with a great deal of speculative short positions in the US bond and note futures markets, their short covering might be enough to take them higher for a while longer. A lot of those positions were put on as a result of anticipating the "slowing global growth" scenario; in other words, deflationary forces.
If this market however does not reverse course soon, chances are we might have seen a long term low point in interest rates. Stay tuned on this one folks as it will have implications for gold.
Also, I am wondering if the following chart might have something to do with bond and note traders shifting away somewhat from the "falling prices" scenario. I doubt that this in itself would be sufficient to take the bloom off of the deflation rose but when combined with the soaring price of grains, it certainly has to regarded at the very least as a contributing factor.
Note that the gasoline market has retraced 61.8% of its entire decline from the peak made earlier this year. That is a key Fibonacci retracement level. If it powers up and through this level, particularly if it closes the week above this level, odds will favor a push towards $3.20 initially followed by a test of the high near $3.40 if the former level does not hold. Generally speaking, if a market fails at the 61.8% level, it will drop back towards the 50% level and retest that to see if the bulls are still eager to buy.

By the way, if the shift towards inflation fears has gained ascendancy over the fear of deflation, you silver guys will be very happy indeed. Again, let's watch what develops. It is still too early too tell and we are not out of the wood yet on the European debt mess but things are indeed getting interesting.
Take a look at the following chart denoting the interest rate being paid or the yield on the US Ten Year Note. Within the span of a mere 3 weeks or so, this yield has shot up from down near 1.4% all the way to 1.8%. That is a very rapid shift. It is now sitting at levels that we have not seen since the middle of May of this year.
From a technical analysis perspective, it has reached an inflection point. ON the way down, this 1.8% level, held the market in check back late last year and early this year. Once it was broken to the downside in May, it subsequently tried to rally back above that level but failed. From that point on, it was straight downhill.

Now it has regained this level. Where it closes this week is going to be critical to our understanding of where things are headed in the following weeks. Apparently, investors have moved past the European debt crisis in their thinking (at least for the present). Something has gotten their attention to the point that they are pushing up interest rates.
Now, whether the Fed is particularly happy with this remains unclear but one has to suspect that the last thing the Federal Reserve wants to see is these longer dated rates getting too far out of hand. Also, keep in mind that the higher these yields move, the higher the cost of servicing the gargantuan, humungous, mind-boggling, stupendously large (how's that for superlatives?) US federal debt burden will become.
Given the mediocre condition of the US economic recovery, it is difficult for me to envision yields breaching this overhead resistance level. Still with a great deal of speculative short positions in the US bond and note futures markets, their short covering might be enough to take them higher for a while longer. A lot of those positions were put on as a result of anticipating the "slowing global growth" scenario; in other words, deflationary forces.
If this market however does not reverse course soon, chances are we might have seen a long term low point in interest rates. Stay tuned on this one folks as it will have implications for gold.
Also, I am wondering if the following chart might have something to do with bond and note traders shifting away somewhat from the "falling prices" scenario. I doubt that this in itself would be sufficient to take the bloom off of the deflation rose but when combined with the soaring price of grains, it certainly has to regarded at the very least as a contributing factor.
Note that the gasoline market has retraced 61.8% of its entire decline from the peak made earlier this year. That is a key Fibonacci retracement level. If it powers up and through this level, particularly if it closes the week above this level, odds will favor a push towards $3.20 initially followed by a test of the high near $3.40 if the former level does not hold. Generally speaking, if a market fails at the 61.8% level, it will drop back towards the 50% level and retest that to see if the bulls are still eager to buy.

By the way, if the shift towards inflation fears has gained ascendancy over the fear of deflation, you silver guys will be very happy indeed. Again, let's watch what develops. It is still too early too tell and we are not out of the wood yet on the European debt mess but things are indeed getting interesting.
Subscribe to:
Posts (Atom)