Here are some gold charts once again to take a look at where things stand in that market.
Let's start with the Daily....
Note I am only using the ADX on these charts as I am trying to discern a TREND change.
The first thing to notice is that the ADX line has now turned down from a high level (above 43). That tells us that the downtrend has been temporarily halted. I have noted previous downturns in the ADX by ellipses. Note that the market has experienced some upward moves in price that followed such events. Therefore, the POSSIBILITY exists that we could see a relief rally in gold.
In my view, this will only occur IF the bulls can take price through the overhead resistance line I have noted. If that were to occur, you could see enough short covering to take the price up towards the 50 moving average which is currently moving lower ( the trend has been down) and which comes in near the $1292 level.
While the ADX has turned down indicating that the current leg lower has stalled out, the Negative Directional Indicator ( Red Line ) remains above the Positive Directional Indicator ( Blue Line) indicating that the Bears are still in control of this market on the daily time frame. I do not see any bullish divergences among those indicators at this time.
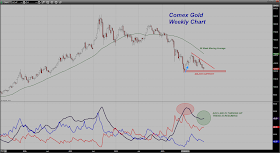
Let's shift now to the Weekly Chart...
Can you see the difference in the ADX line on this time frame? While it did turn down late in July indicating the disruption of the intermediate term downtrend, it HAS NOT TURNED DOWN at this time. Actually it is NOW RISING. Translation - on this intermediate time frame, the downtrend in gold appears to be resuming. That is in stark contrast to the daily chart.
Keep this in mind - all trend changes will FIRST be detected on the Daily Chart. Later action will then determine whether or not such a trend change is occurring as well on the intermediate or Weekly Chart or whether this is just another move higher in an ongoing bear market. One really has no way of knowing this at this stage. Only viewing subsequent price action can determine this. It is important to note however that the longer the time frame used, the more important the trend. What this means is that the onus is on the bulls to prove that control of the market by the bears is in jeopardy.
Note that the Negative Directional Movement Indicator ( Red Line ) is firmly above the Positive Directional Movement Indicator ( Blue Line ). The Bears are firmly in charge on the intermediate time frame.
Generally speaking, rallies in gold will thus be sold until proven otherwise.


This comment has been removed by the author.
ReplyDeleteHi Dan,
ReplyDeleteFirst comment got deleted by accident so posting it again - sorry!
I've read your blog regularly for the past 8 months or so. You're a great trader and contribution to open sharing of experience when it comes to learning to read charts/price action.
I'd like your thoughts on the price action Gold experienced over the last week and a half. It seems like we stumbled from the 1250 mark, down to 1225, back towards 1250, down to 1218, up yet again to 1250, and again back down to touch 1210 right after the job report came out, spiking to as high as 1241, before closing off Friday below 1230.
This price action reminds me of Gold's behavior before the huge drop from the high 1300s to 1180 back in June. I recall that Gold was range bound between 1380 and 1420, bouncing between the two and unable to break through that 1420 resistance area, ultimately sliding down to the yearly low that we made at 1180.
Do you see this potentially playing out here, with 1250 being that resistance level? If so, and the 1200 mark is breached, where do you potentially see the next area of major support being?
Looking at that weekly chart you've posted, I just have a gut feeling that 1180 is going to get retested soon.
Look forward to your thoughts. Thanks!
Syncubate;
DeleteThank you for the kind words.
Gold has gone back to a range trade after the downtrend failed to extend below $1210. The resistance zone extends from $1245 on up to $1260 or so. That area seems to attract selling while $1210 is attracting solid buying.
both bulls and bears are looking to grab the advantage but neither side can take the metal out of this range right now.
The intermediate term trend favors the bears so the bulls have the onus on them to prove that they can wrest control of the market from the shorts.
My bias is in favor of the bears but I am not dogmatic about that right now as long as $1210 holds. If that fails however, all bets are off for the bulls as the market should extend another leg lower and will probably lose the "12" handle.
Let's watch the price action and see what we get. A professional trader never gets too inflexible. You have to be willing to admit when you are wrong. There is no problem with that. The problem exists when one cannot admit that! Be flexible and adapt. That is the key to trading success!
No comment today, just a big thank you for sharing your knowlege so generously. Cheers, Andy - Cape Town.
ReplyDelete