Quite frankly, until traders become convinced that some sort of policy move by Central Bank Planners which will stem the downward economic spiral is forthcoming, they are not going to buy. It will be up to the big physical market buyers, mainly the Asian Central Banks, who are valued based buyers, to put a floor under the gold market.
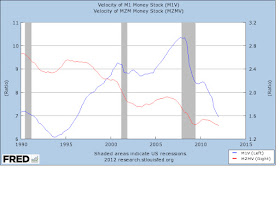
Many keep pointing to the amount of money that has already been injected into the system in expectation that inflation issues are mere moments away. Unfortunately, if that were the case, we would already be seeing soaring commodity prices and of course a soaring gold price. The problem is that the rate at which this money is turning over or changing hands in the economy, the VELOCITY OF MONEY, continues to plummet.
Notice the following chart detailing the VELOCITY OF MONEY. I have charted the simplest measure of money supply (M1) as well as the more complex measure (MZM). No matter which one we take, VELOCITY is trending lower. What this means is that while the Fed has been busy injecting liquidity into the system, it really is not going anywhere (besides into the US equity markets by the Big Banks). The result is that while the FUEL FOR INFLATION is in place, the WIND TO FAN THE FLAMES is currently missing. People and business are simply not spending money at a fast enough pace to fan the fires of inflation.
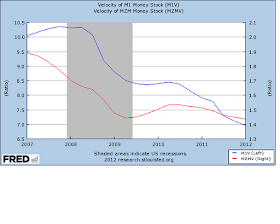
Let's zoom in a bit closer to see some more detail. Notice that it was not until the first round of QE1 was underway in early 2009 that VELOCITY began to increase. It had collapsed as the credit crisis erupted in the middle of 2008 and the Fed came charging in to arrest that ominous trend. Of course it was no coincidence to see gold rally from a low of 680 prior to the first round of QE all the way to near $1250 during the same time period that the slope of the Velocity line turned higher.
Gold continued to rally higher even despite the fact that the graph turned lower as traders still believed that the total sum of near $2.5 TRILLION in combined QE would set the stage for soaring inflationary issues. Commodity prices roared higher and the US Dollar sank lower. After all, we were talking about an unprecedented amount of money creation. Alas, it was all to no avail as the issues with the enormous amounts of indebtedness swallowed it all up with woes out of Europe further complicating issues.
From where I stand, it seems to me that if the Fed is eventually going to launch another round of stimulus, not that it will accomplish anything of LASTING significance, it is not going to have any desired impact unless it is of sufficient size that it turns this VELOCITY chart higher. It seems that the law of diminishing returns may well be at work with the market dismissing any QE package that is not at least as large as the prior ones and that means a minimum size of $900 billion as was QE2 ($600 billion in Treasuries and $300 billion in Agency debt).
Quite frankly, it would be downright terrifying if the Fed were to announce a new round of QE of say, $500 billion, and the markets, after an initial knee jerk response higher, were to sell off. Imagine the size that would then be needed. Perhaps this is one of the reasons that they are reluctant at this point to pull the trigger on the next round of QE. Maybe they are fearful of the reaction if the markets are disappointed? Then what would they do - buy stocks directly??? Personally I keep waiting for them to cut a check to every individual taxpayer. Now that is my kind of stimulus! For that matter, why not just cancel the income tax altogether - after all, who need revenue when you are spending yourself into oblivion anyway.
One last chart - that of gold itself - it has been rejected from the resistance level near $1620 - $1625 shown on the chart. That level was the bottom of the former consolidation range. It is now moving lower again down towards the bottom of its NEW congestion zone with $1550 - $1525 on the bottom. This is the zone into which Asian Central Bank buying has been very strong in the past. Hopefully this will continue.
This sort of value-based buying is what carves out floors in markets. However, to see strong uptrending moves, particularly in gold, we are going to need to see a sentiment shift in the minds of traders away from fearing slowing global growth and deflationary pressures towards one of fearing rising prices and inflationary pressures. That is going to require some sort of catalyst. What form that takes and when exactly it occurs is unclear but considering the amount of liquidity that has been injected into the system, when the VELOCITY chart does indeed change, it will be no mean or small event when it does!


