What an impressive performance by Ol' Yeller for the month of August! Note that Gold has bettered the all time high CLOSING price on an inflation adjusted basis.
Wednesday, August 31, 2011
Gold marking time
Gold has been relatively quiet after the extreme volatility of recent days, a very welcome development. You can note the declining trend in volume as evidence of the more "tranquil" trading conditions. We are currently running into overhead selling resistance near $1850 with buyers either unwilling or unable to take it through this level without some sort of fresh news. Sellers meanwhile have been thwarted in any efforts to break prices significantly lower.
The present posture is one of consolidation with some buying surfacing down near the $1800 level and further below towards $1780.
A strong push through $1850 that can carry through the $1860 level would set up the potential for a push towards the recent peak near $1900.
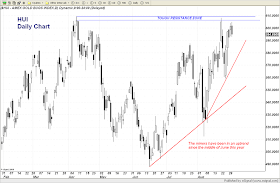
There is some pressure coming into gold based on today's weakness in the HUI and the inability of that index to push through tough overhead resistance at the former all time high set back in April of this year. Last week the miners pushed up through the 600 level but could not quite muster enough strength to best that previous peak. Price then set back but has subsequently rallied back towards 600 once again, failing today to extend those gains and dropping off lower. For all that, one can still see quite clearly that the miners have been in a nice uptrend since bottoming out in mid June. The more time this index can spend above 580 the better the odds grow that it is soon to mount a breakout and begin its next leg higher.
Silver's status is similar to that of gold's right now. It is consolidating with a short term bias that is friendly. It is being prevented from moving towards $44 by selling originating near the $42.50 level. That will have to be overcome if this thing is going to have a shot at a stronger climb. Note that it is trading near the 50% Fibonacci retracement level from the April peak and May low.
Support is still down near $39.30.


